KO
|
EN
gitlite — search
Search
#python
#typescript
#react
#machine-learning
#hacktoberfest
#rust
#reactjs
#llm
#nextjs
#javascript
#docker
#postgresql
wireguard-chart
★ 73
Open GitHub ↗
A helm chart for wireguard
Download README (.md)
Explore Similar Repositories
BlackboardSync
:
Download your Blackboard Learn content automatically
Course-Review
:
一些课内的笔记、资料
heiyeluren-doc
:
黑夜路人个人原创内外部分享技术文档汇集,包含各个阶段的技术文档和分享的PPT等
manymouse
:
Simple, cross-platform library to handle multiple mice.
spotify-recommender-systems
:
Exploration implementing recommender systems using Spotify data.
// repository documentation
Was this content helpful?
★ 0
(0 ratings)
Select Rating:
★
★
★
★
★
Submit Feedback
Recent Feedback
×
Download README
Do you want to download the
README.md
file for
wireguard-chart
?
Download (.md)
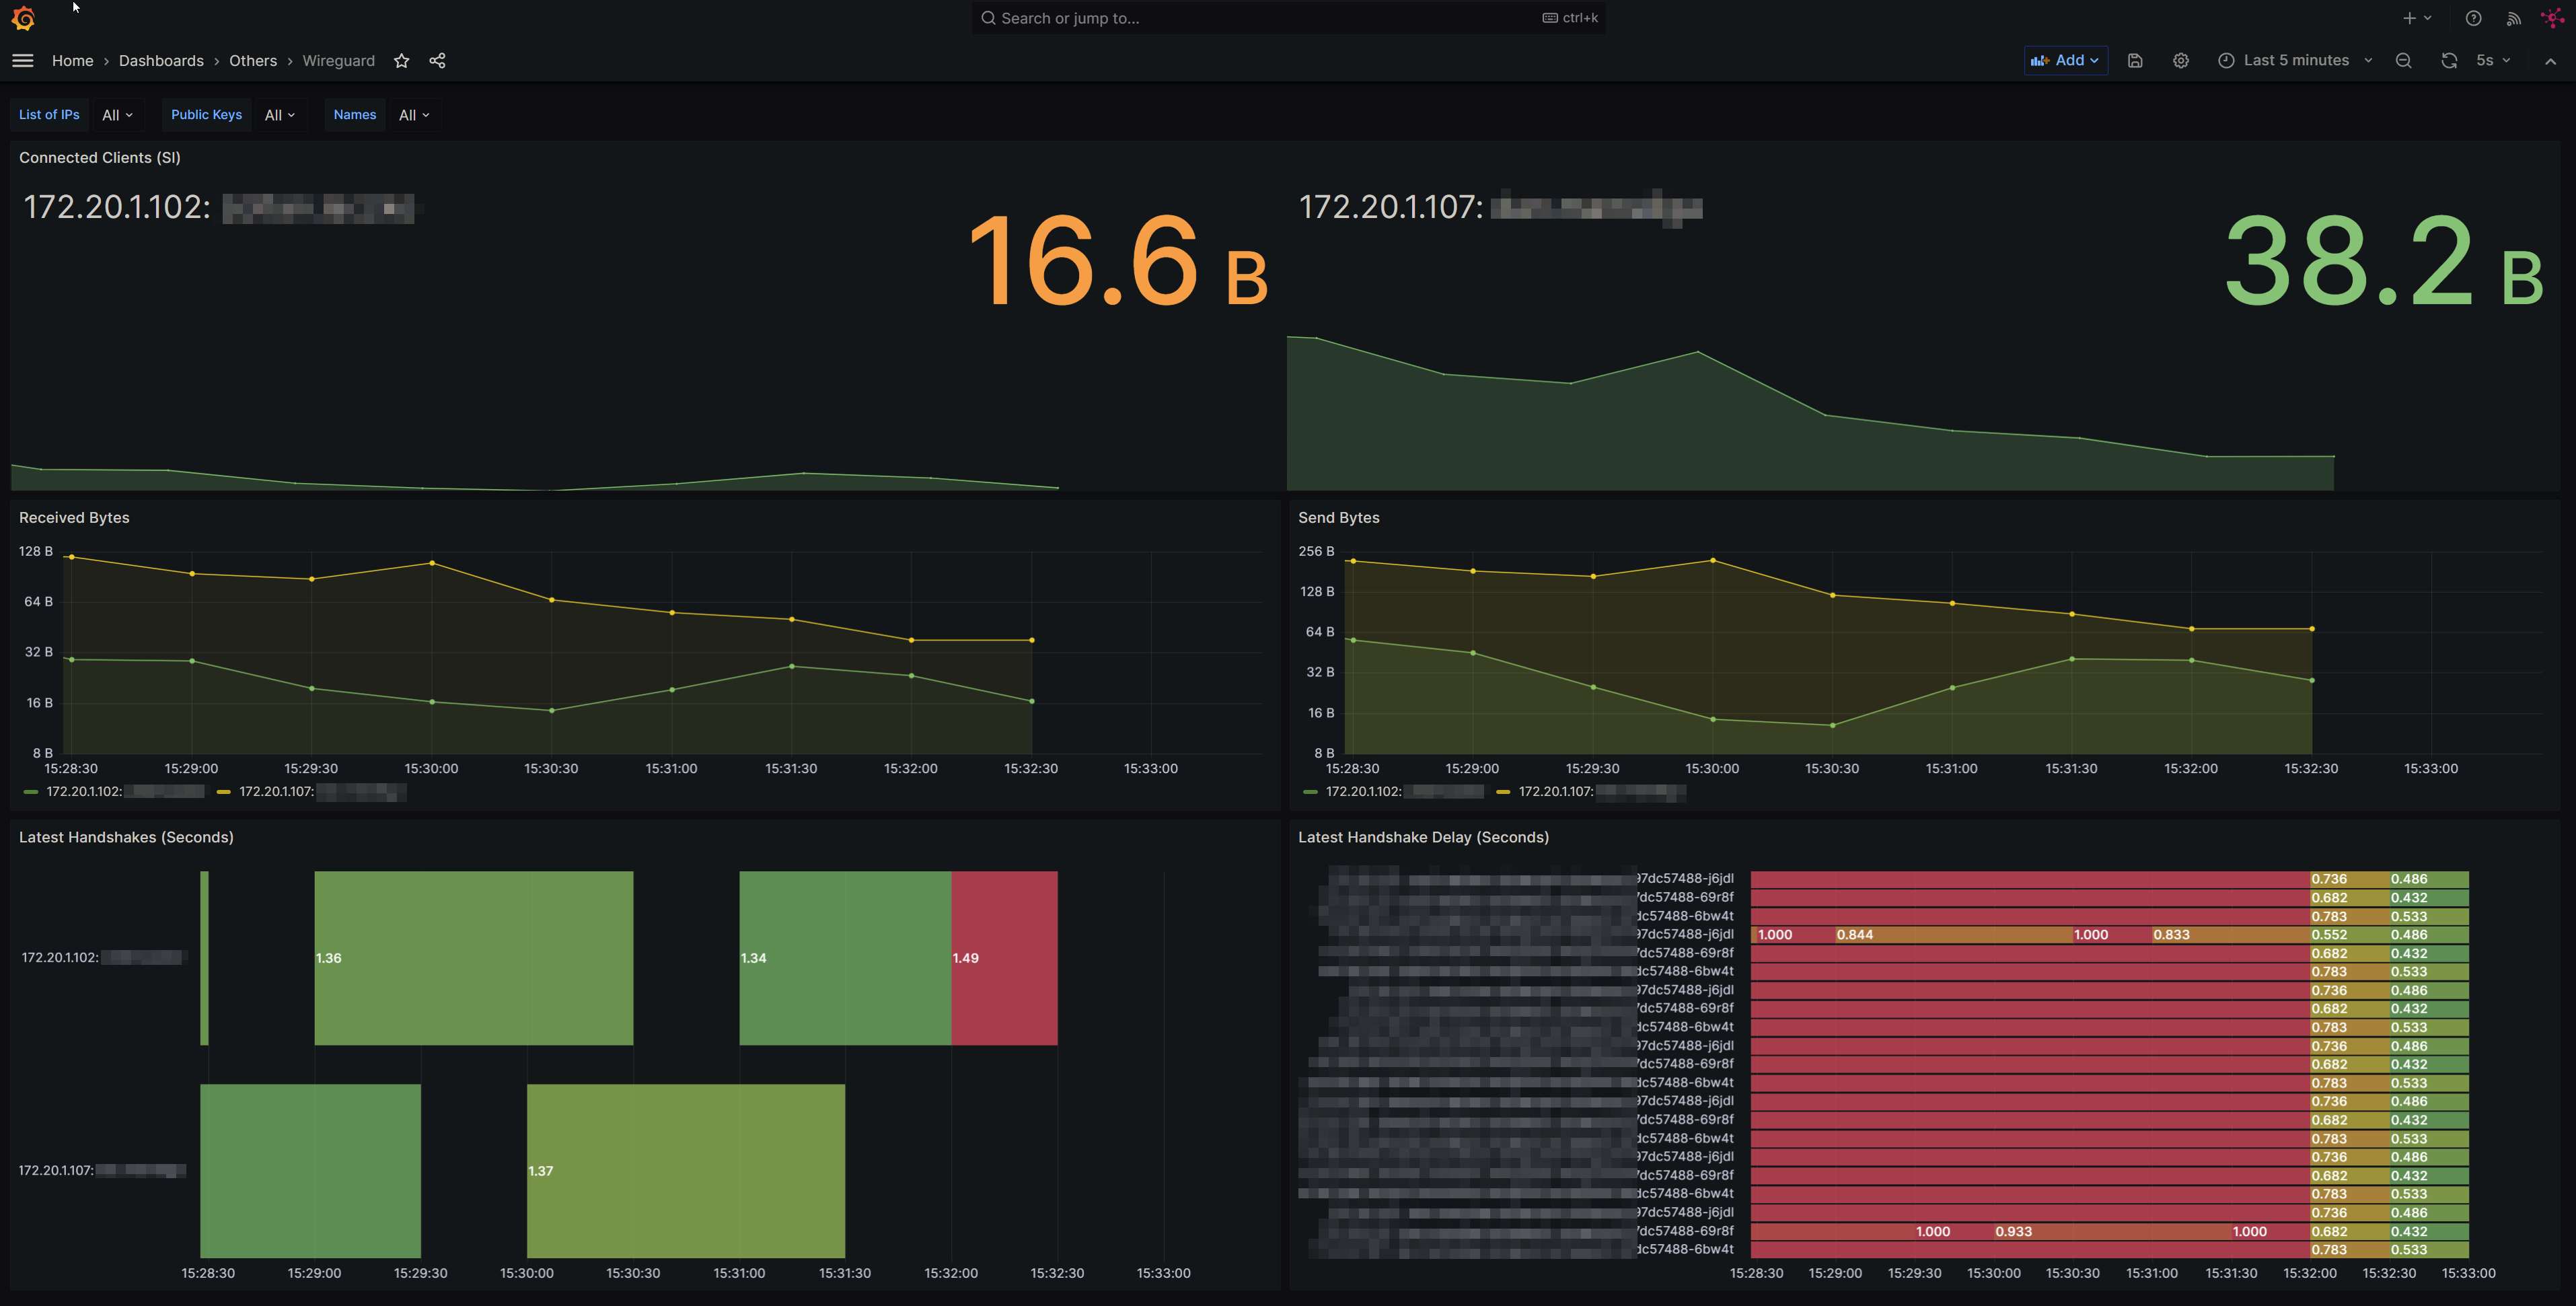
# Wireguard Chart A simple chart that can be used to run wireguard inside of a Kubernetes cluster. ## Add the helm repo To add this helm repo, run `helm repo add wireguard https://bryopsida.github.io/wireguard-chart` followed by a `helm repo update` to fetch the contents. ## Deploy To deploy with defaults and use the automatically generated private key you can use `helm upgrade --install wg-vpn-1 wireguard/wireguard --namespace <your namespace>`. This will create a load balancer service exposing UDP port `51820`, to run multiple wireguard releases you will need to change the service port to avoid collisions, you can find the helm values documentation [here](helm/wireguard/README.md). By default no client configurations are added. The default CIDR for the VPN network is `10.34.0.1/24` ## Maintain client configurations Follow the wireguard [documentation](https://www.wireguard.com/quickstart/) for generating keys and determining client IPs. Clients can be set by providing the following yaml override values. ``` yaml wireguard: clients: - PublicKey: <your client public key here> AllowedIPs: 10.34.0.2/32 ``` And feeding it into helm `helm upgrade --install wg-vpn-1 wireguard/wireguard --namespace <your namespace> -f <path-to-your-overides>` ## Example Tunnel Configuration(s) ### Route all traffic and use kube-dns If you want to route all traffic through WireGuard and use the cluster dns to allow service discovery, you can use the following tunnel configuration. Release values ``` yaml service: port: 51225 wireguard: allowWan: false clients: - AllowedIPs: 172.32.32.3/32 PresharedKey: <redacted> PublicKey: <redacted> - AllowedIPs: 172.32.32.2/32 PresharedKey: <redacted> PublicKey: <redacted> serverAddress: 172.32.32.1/24 serverCidr: 172.32.32.0/24 ``` Where kube-dns service ip address is `10.43.0.10`. ``` ini [Interface] PrivateKey = <redacted> Address = 172.32.32.2/32 DNS = 10.43.0.10 [Peer] PublicKey = <redacted> PresharedKey = <redacted> AllowedIPs = 0.0.0.0/0 Endpoint = <host>:<ip> of wireguard endpoint ``` How you can test it works: 1) Pick a internal K8S service. I'm going to use a couchdb service as an example. 2) Dig it as shown below 3) You should see that the kube-dns server answers it and you should be able to resolve A records ``` shell dig couchdb-couchdb.couchdb.svc.cluster.local ; <<>> DiG 9.10.6 <<>> couchdb-couchdb.couchdb.svc.cluster.local ;; global options: +cmd ;; Got answer: ;; WARNING: .local is reserved for Multicast DNS ;; You are currently testing what happens when an mDNS query is leaked to DNS ;; ->>HEADER<<- opcode: QUERY, status: NOERROR, id: 65023 ;; flags: qr aa rd; QUERY: 1, ANSWER: 6, AUTHORITY: 0, ADDITIONAL: 1 ;; WARNING: recursion requested but not available ;; OPT PSEUDOSECTION: ; EDNS: version: 0, flags:; udp: 4096 ;; QUESTION SECTION: ;couchdb-couchdb.couchdb.svc.cluster.local. IN A ;; ANSWER SECTION: couchdb-couchdb.couchdb.svc.cluster.local. 5 IN A <redacted> couchdb-couchdb.couchdb.svc.cluster.local. 5 IN A <redacted> couchdb-couchdb.couchdb.svc.cluster.local. 5 IN A <redacted> couchdb-couchdb.couchdb.svc.cluster.local. 5 IN A <redacted> couchdb-couchdb.couchdb.svc.cluster.local. 5 IN A <redacted> couchdb-couchdb.couchdb.svc.cluster.local. 5 IN A <redacted> ;; Query time: 51 msec ;; SERVER: 10.43.0.10#53(10.43.0.10) ;; WHEN: Sun Apr 02 15:04:51 CDT 2023 ;; MSG SIZE rcvd: 41 ``` If you are using something like cilium and have access to hubble you can verify the network flows there as well. ## Prometheus Metrics ```yaml metrics: enabled: true ``` - Adds another container with [prometheus_wireguard_exporter](https://github.com/MindFlavor/prometheus_wireguard_exporter) - Installs a Prometheus ServiceMonitor to scrape metrics from the wireguard server - Deploys a Grafana dashboard: