KO
|
EN
gitlite — search
Search
#javascript
#python
#hacktoberfest
#react
#ai
#typescript
#llm
#go
#golang
#android
#machine-learning
#rust
#deep-learning
#linux
go-proxy
★ 9
Open GitHub ↗
No description available.
Download README (.md)
Explore Similar Repositories
Neuron-Companion
:
No description available.
PLE_Economic_Agency_Index
:
Public heatmap of US per county EAI (Economic Agency Index
VideoCall-System
:
No description available.
a2a-template-langgraph
:
A production-ready agent server built with LangGraph that implements the Agent-to-Agent (A2A) protocol
sigma_connect_ha
:
Provides real-time status updates, sensor info, and alarm control via local network connection to Sigma Ixion alarm systems.
// repository documentation
Was this content helpful?
★ 0
(0 ratings)
Select Rating:
★
★
★
★
★
Submit Feedback
Recent Feedback
×
Download README
Do you want to download the
README.md
file for
go-proxy
?
Download (.md)
# Go Proxy - AI 服务代理工具 一个轻量级的 HTTP 代理服务器,专为解决 AI 服务访问问题设计。支持多路由代理、请求统计和美观的数据可视化界面。 [](https://github.com/xmengnet/go-proxy/actions/workflows/docker-publish.yml) ## 核心特性 - 🚀 **多路由代理**: 通过 YAML/JSON 配置多个代理规则 - 📊 **数据统计**: 实时监控请求次数、响应时间等指标 - 💰 **成本追踪**: 统计 API 调用成本 - 🎨 **现代界面**: 响应式设计 + 暗色模式 - 🔄 **余额查询**: 支持硅基流动 API 余额查询 - 🐳 **容器支持**: 提供 Docker 镜像,支持 Docker Compose 部署 ## 界面预览 ### 主界面 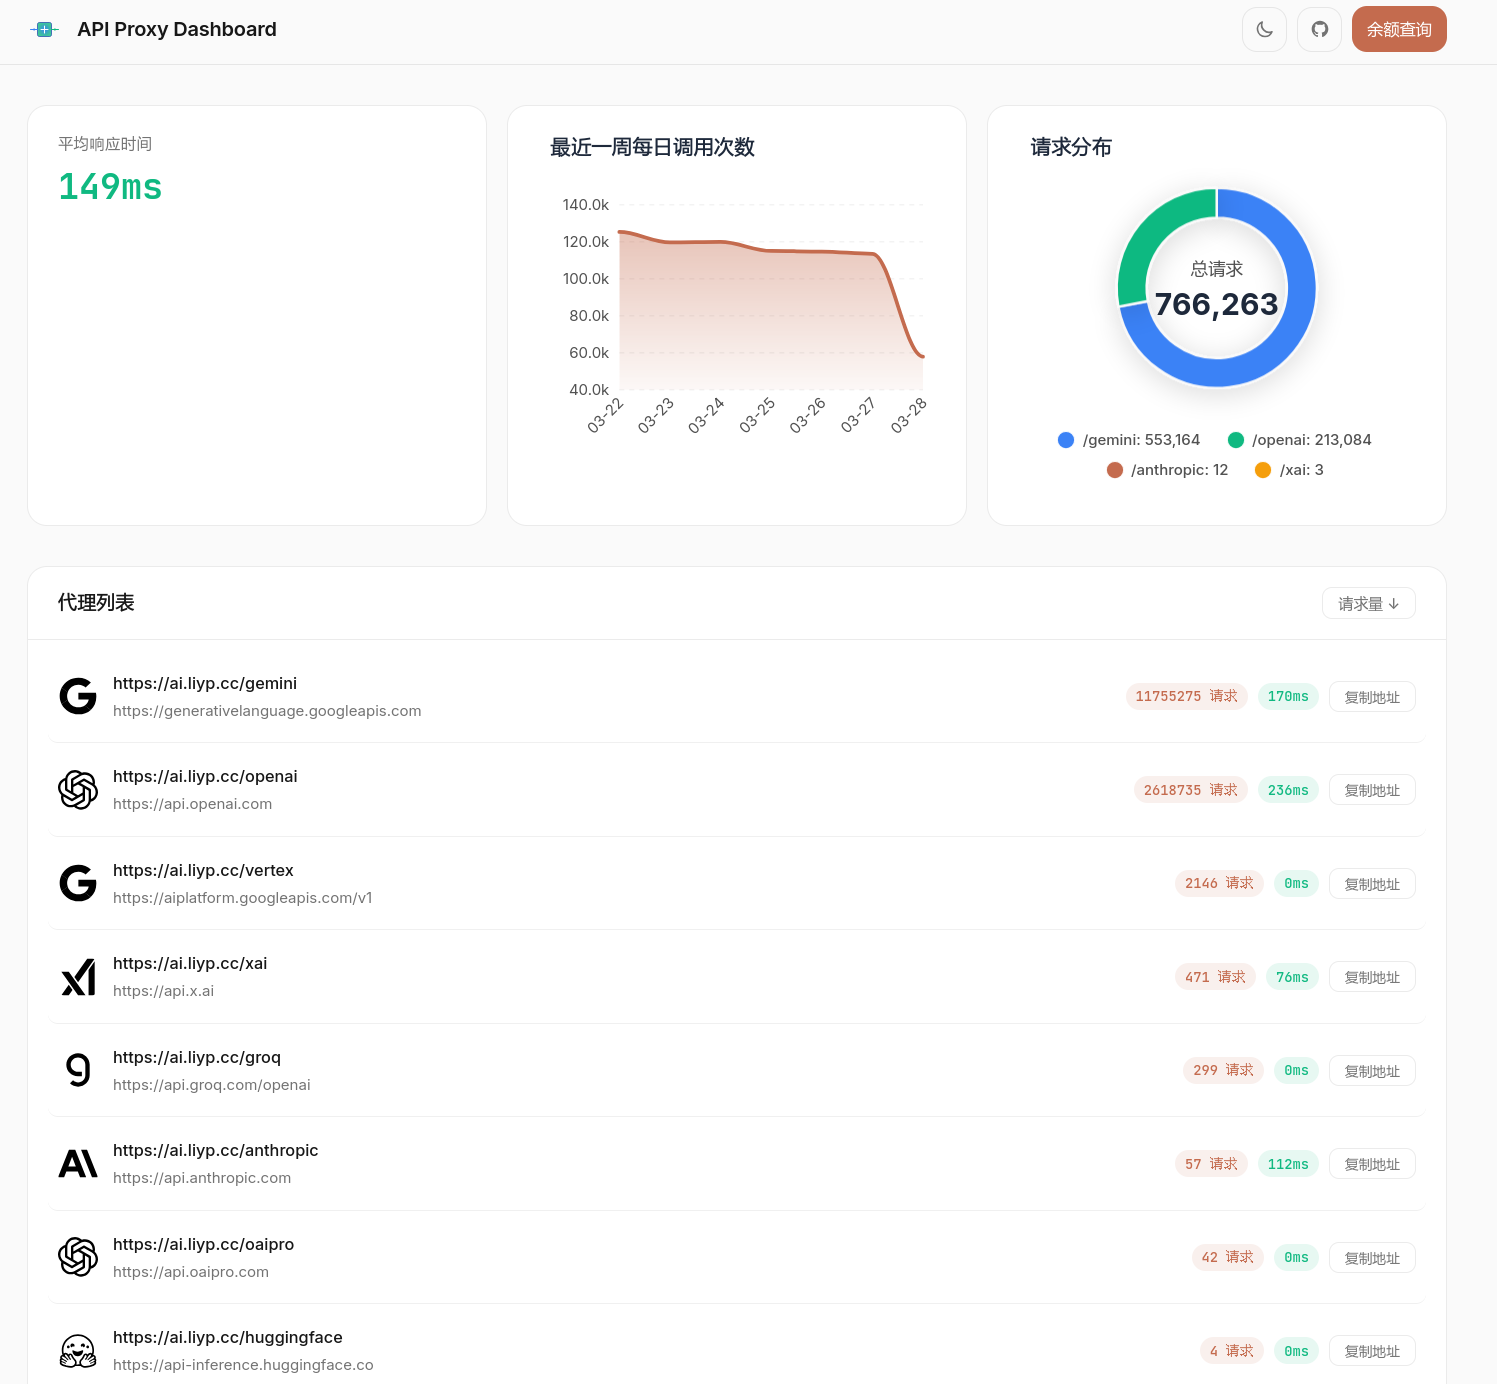 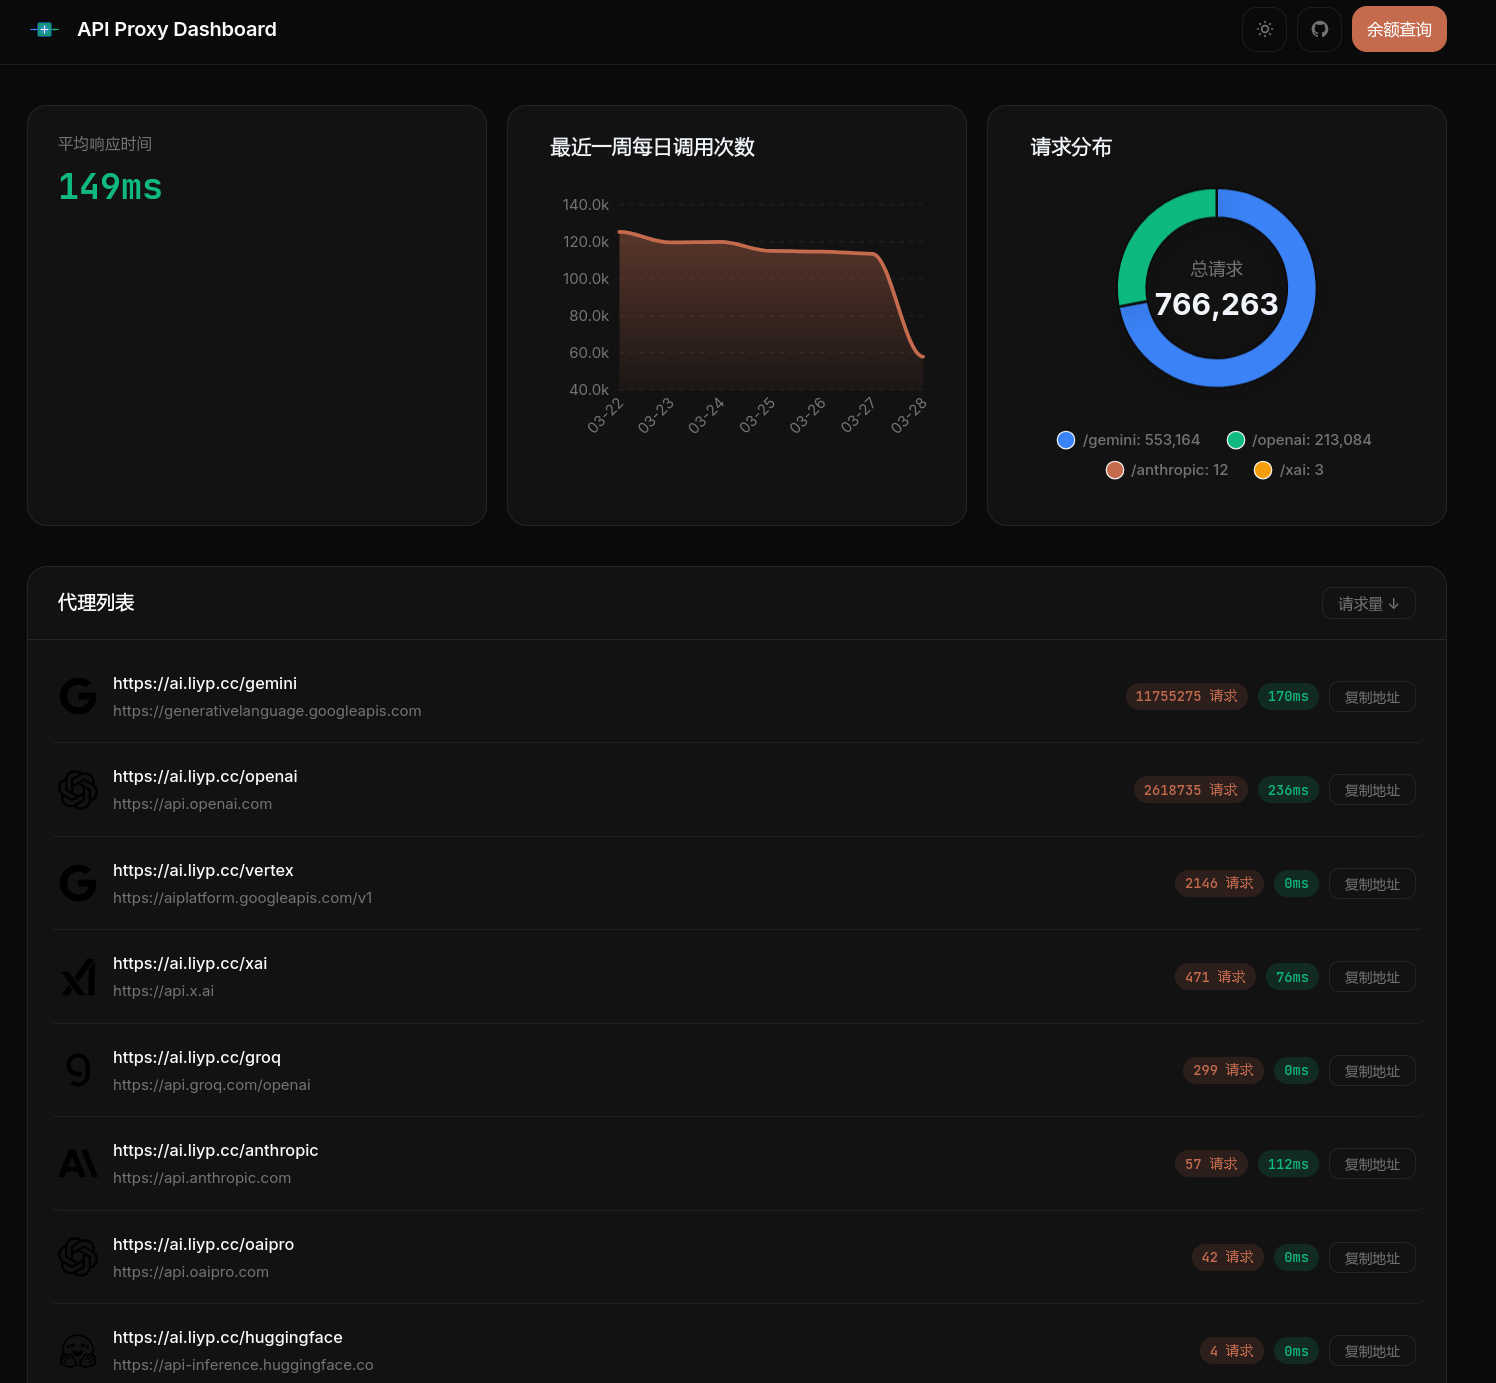 ### API 余额查询界面 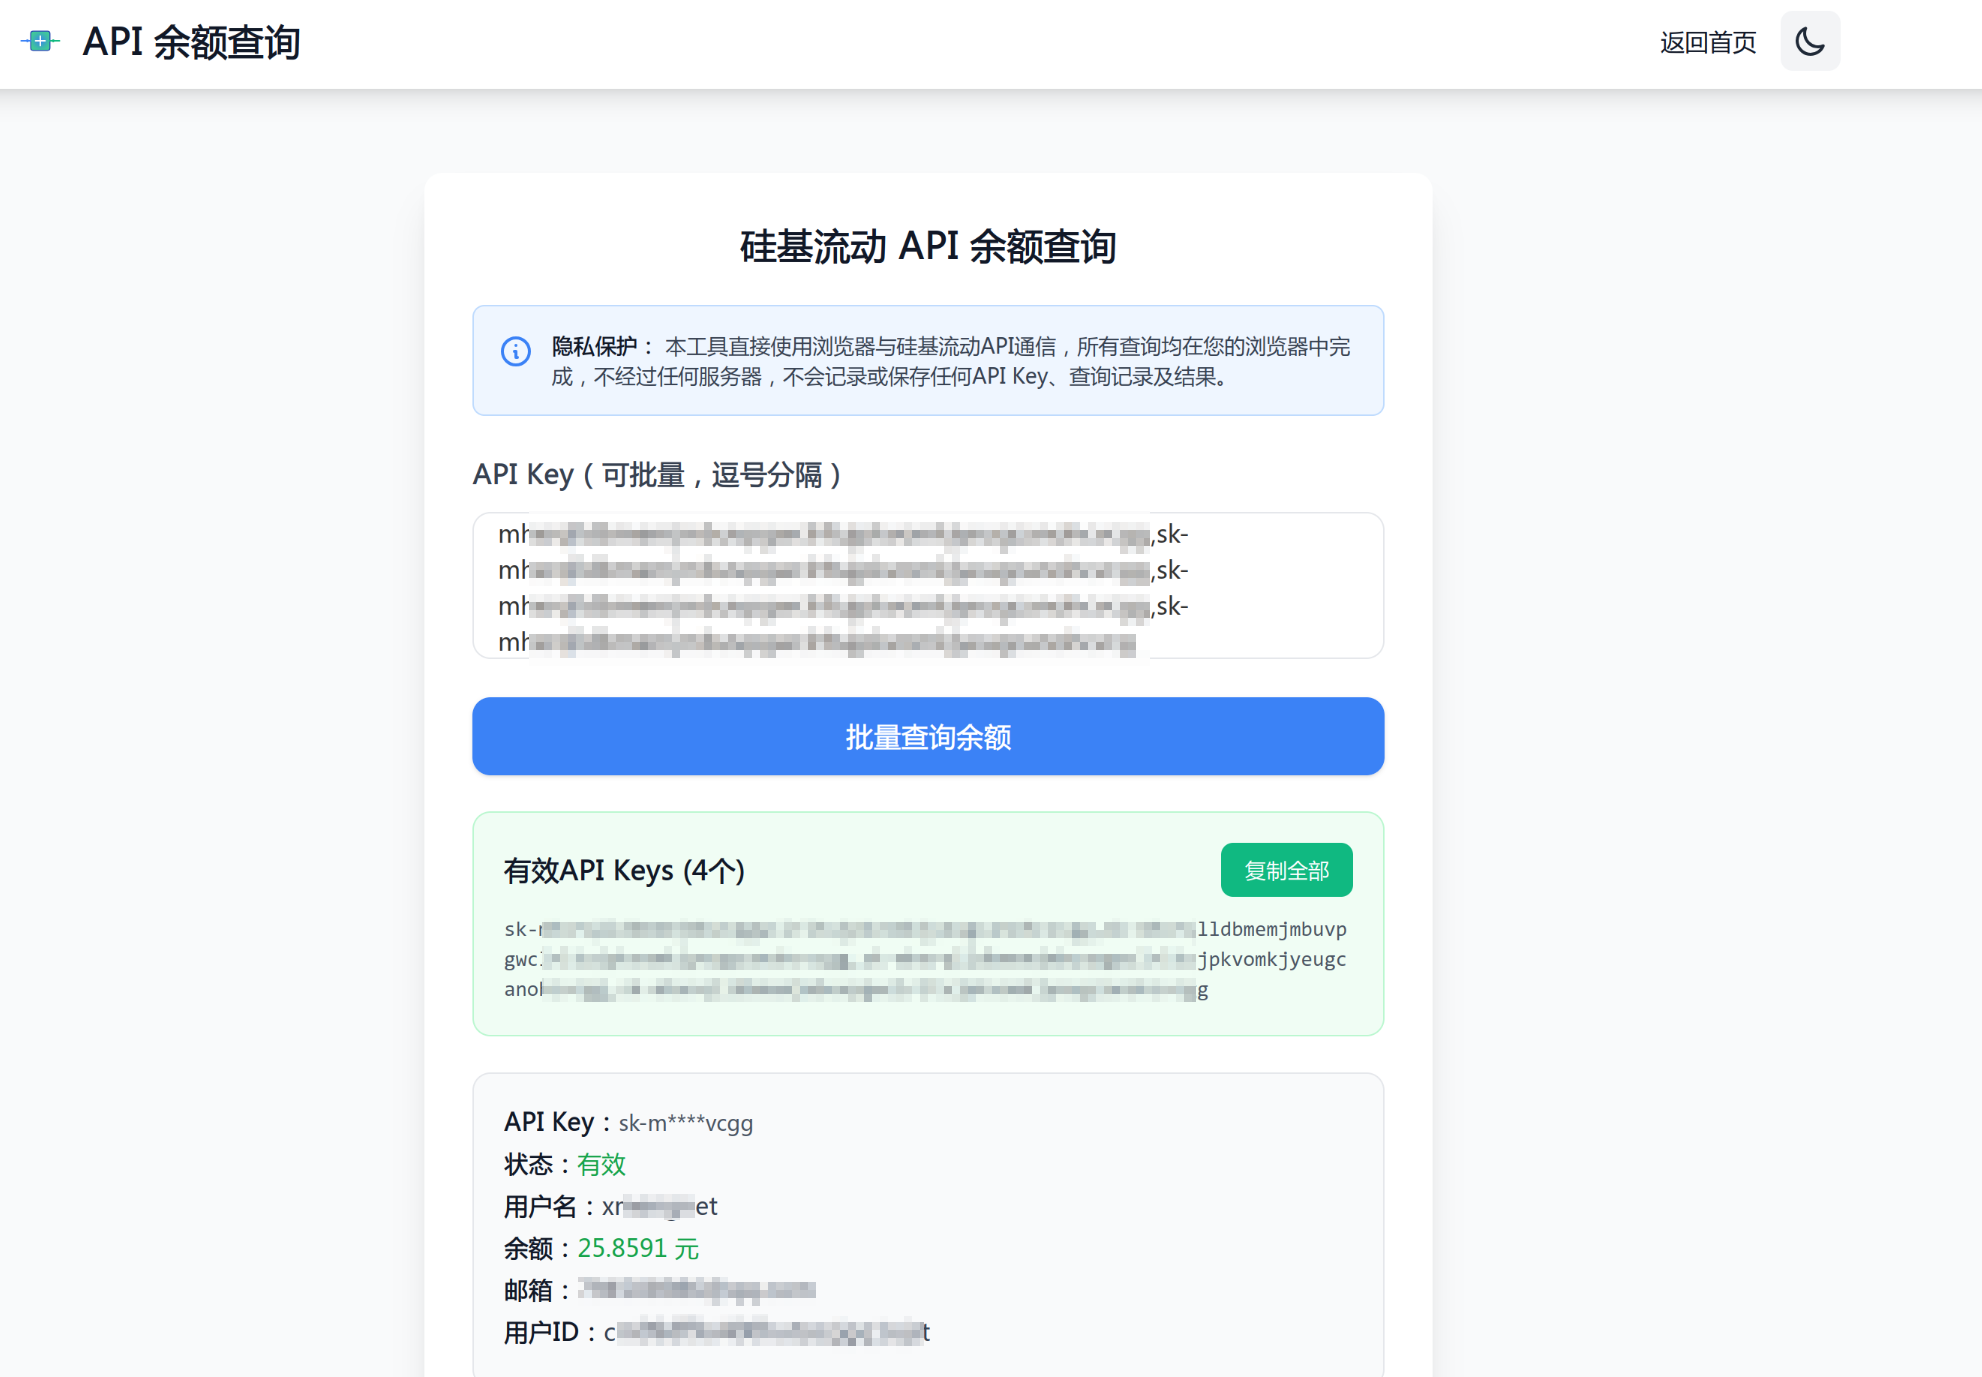 ## 快速开始 ### Docker 运行 ```bash # 拉取镜像 docker pull xmengnet/go-proxy # 运行容器 docker run -d \ -p 8080:8080 \ -v $PWD/data:/app/data \ --name go-proxy \ xmengnet/go-proxy # 注意需要 data 目录下有配置文件 ``` ### 源码运行 ```bash # 克隆项目 git clone https://github.com/xmengnet/go-proxy.git cd go-proxy # 安装依赖 go mod tidy # 运行 go run main.go ``` ## 配置说明 创建 `data/config.yaml` 文件: ```yaml server: port: "8080" # 服务器端口 proxies: - path: "/gemini" # 匹配路径 target: "https://generativelanguage.googleapis.com" # 目标地址 vendor: "google" # 厂商标识 - path: "/anthropic" target: "https://api.anthropic.com" vendor: "anthropic" ``` ## 构建与运行 1. **克隆项目**: ```bash git clone https://github.com/xmengnet/go-proxy.git cd go-proxy ``` 2. **安装依赖**: ```bash go mod tidy ``` 3. **配置**: 编辑 `data/config.yaml` 文件,配置代理规则。示例配置如下: ```yaml server: port: 8070 retention_days: 90 # 可选,数据保留天数,不填默认90天 metrics: enabled: true # 是否启用 /metrics 端点,默认 false username: "admin" # Basic Auth 用户名(留空则不启用认证) password: "changeme" # Basic Auth 密码 proxies: - path: "/gemini" # 代理路径 target: "https://generativelanguage.googleapis.com" # 目标地址 vendor: "google" # 厂商标识 - path: "/anthropic" target: "https://api.anthropic.com" vendor: "anthropic" ``` ## 容器镜像 - GitHub Container Registry: `ghcr.io/xmengnet/go-proxy` - Docker Hub: `xmengnet/go-proxy` 支持的标签格式: - `vX.Y.Z`: 具体版本 - `X.Y`: 主次版本 - `latest`: 最新版本 ## 配置文件 配置文件支持 YAML 和 JSON 两种格式,包含以下配置项: * `path`: 匹配的请求路径前缀。 * `target`: 请求将被转发到的目标地址。 * `vendor`: (可选)AI 服务提供商标识,用于显示对应的图标。支持的值包括: * `google`: Google (Gemini) * `anthropic`: Anthropic * `openai`: OpenAI * `groq`: Groq * `huggingface`: Hugging Face * `x`: xAI 示例配置(YAML 格式): ```yaml server: port: "8080" retention_days: 90 # 可选,数据保留天数,不填默认90天 proxies: - path: "/gemini" target: "https://generativelanguage.googleapis.com" vendor: "google" - path: "/openai" target: "https://api.openai.com" vendor: "openai" ``` ## Prometheus 监控 go-proxy 内置 Prometheus 指标暴露,支持通过 `/metrics` 端点采集监控数据。 ### 配置 在 `data/config.yaml` 中添加 `metrics` 配置段: ```yaml metrics: enabled: true # 是否启用 /metrics 端点,默认 false username: "admin" # Basic Auth 用户名(留空则不启用认证) password: "changeme" # Basic Auth 密码 ``` ### 验证 ```bash # 无认证 curl http://localhost:8080/metrics # 有 Basic Auth curl -u admin:changeme http://localhost:8080/metrics ``` ### 指标列表 | 指标名 | 类型 | 标签 | 说明 | |--------|------|------|------| | `goproxy_http_requests_total` | Counter | `service`, `method`, `status_code` | 请求总数 | | `goproxy_http_request_duration_seconds` | Histogram | `service`, `method` | 响应时间分布 | | `goproxy_http_response_size_bytes` | Histogram | `service` | 响应体大小分布 | | `goproxy_upstream_errors_total` | Counter | `service`, `error_type` | 上游错误计数 | | `goproxy_active_requests` | Gauge | `service` | 当前并发请求数 | | `goproxy_stats_channel_usage` | Gauge | — | 统计通道使用量 | | `goproxy_stats_channel_drops_total` | Counter | — | 通道满丢弃次数 | | `goproxy_stats_batch_process_total` | Counter | — | 批处理执行次数 | | `goproxy_db_errors_total` | Counter | `operation` | 数据库错误次数 | 此外还会自动暴露 Go Runtime 指标(`go_goroutines`、`go_memstats_*`、`process_*`)。 ### Prometheus 配置示例 ```yaml # prometheus.yml scrape_configs: - job_name: 'go-proxy' scrape_interval: 15s metrics_path: '/metrics' basic_auth: username: 'admin' password: 'changeme' static_configs: - targets: ['localhost:8080'] ``` ### Grafana Dashboard 项目内置了预配置的 Grafana Dashboard,包含 5 个分区、20+ 面板: | 分区 | 面板 | |------|------| | 📊 概览 | 总请求数、QPS、平均响应时间、并发数、错误数、Goroutines | | 🔀 请求流量 | 各服务 QPS、状态码分布、请求占比饼图、排行榜 | | ⏱️ 响应时间 | P50/P99 延迟、平均响应时间、响应时间热力图 | | ⚠️ 错误与上游 | 上游错误趋势、错误率、错误类型统计 | | 🖥️ Go Runtime | 内存使用、Goroutines、GC 频率、文件描述符 | **导入方法**:Grafana → Dashboards → Import → Upload JSON file → 选择 [`data/grafana-dashboard.json`](data/grafana-dashboard.json) → 选择 Prometheus 数据源 → Import ## Web 界面 启动服务器后,访问 `http://localhost:<端口号>/` (替换 `<端口号>` 为配置文件中指定的端口) 即可访问 Web 界面,查看代理规则和实时统计数据。 ## 依赖 * [Echo](https://github.com/labstack/echo): 高性能、可扩展、低内存占用的 Go Web 框架。 * [go-sqlite3](https://github.com/mattn/go-sqlite3): SQLite 驱动。 ## 部署到 Vercel 本项目也可以部署到 Vercel 作为无服务器函数。在 Vercel 环境中,统计功能(数据库和统计中间件)将被禁用,`/api/stats` 接口将只返回代理节点信息(不包含请求次数)。 ### Vercel 配置 在 Vercel 项目设置中,需要配置 `PROXIES_CONFIG` 环境变量来定义代理规则。 * `PROXIES_CONFIG`: 包含一个 JSON 数组的字符串,其中每个元素是一个代理配置对象。格式类似于 `data/config-sample.json` 文件中的 `proxies` 数组部分。 示例 `PROXIES_CONFIG` 环境变量值: ```json [ {"path":"/gemini","target":"https://generativelanguage.googleapis.com"}, {"path":"/google","target":"https://www.google.com"} ] ``` ### 注意事项 * 由于 Vercel 无服务器环境的限制,数据库和请求统计功能不可用。 * `/api/stats` 接口在 Vercel 环境下仅返回代理节点的 `path` 和 `target` 信息,`access_count` 将固定为 0。 * 请注意,Vercel 由于不支持 go 语言的 Flush() 函数,导致流式输出不可用,因此不建议使用 Vercel 部署。 ## 部署到 Render 可以将本项目部署为 Render 的 Web Service。 ### 构建和部署 1. 在 Render 控制台创建一个新的 Web Service。 2. 连接你的 Git 仓库。 3. 配置构建命令 (Build Command),例如 `go build -o go-proxy main.go`。 4. 配置启动命令 (Start Command),例如 `./go-proxy`. 5. 配置环境变量同 Vercel 配置。 ### 配置 可以通过以下方式配置代理规则: 1. **使用 `data/config.yaml`**: 如果将 `data` 目录及其内容包含在部署中,项目将读取 `data/config.yaml` 文件。这是推荐的方式,与本地运行一致。 2. **使用环境变量**: 所有部署方式都支持设置环境变量。你可以通过环境变量来配置需要代理的连接,但是需要 JSON 格式,可以参照 `config/config-sample.json` 配置。 ## 许可证 本项目采用 [MIT 许可证](LICENSE)。
