KO
|
EN
gitlite — search
Search
#python
#java
#python3
#arduino
#golang
#machine-learning
#rust
#html
#flask
#javascript
#seismology
#nodejs
logseq-plugin-query-chart
★ 12
Open GitHub ↗
No description available.
Download README (.md)
Explore Similar Repositories
laravel9_course
:
complete laravel 9 pos course دورة شرح لارافيل 9 قال : ﷺ: «مَنِ استطاعَ منكم أن ينفعَ أخاه فلْيفعَلْ » ❤️ لاتنسونا من صالح الدعاء ❤️
WinEverything
:
Win the world with NEST
TwoFold_DL
:
Deep Learning model for protein and ligand complex structure prediction from sequences and SMILES
video-proxy
:
No description available.
RobotBin
:
No description available.
// repository documentation
Was this content helpful?
★ 0
(0 ratings)
Select Rating:
★
★
★
★
★
Submit Feedback
Recent Feedback
×
Download README
Do you want to download the
README.md
file for
logseq-plugin-query-chart
?
Download (.md)
# Logseq Plugin Query Chart ## Introduction (简介) This plugin can create a chart according to the result of advanced query, so that you can visualize any data in your logseq as you want. 这个插件能根据高级查询的结果绘制图表。帮助你可视化logseq中记录的数据。 ## Usage (使用) 1. Use slash command `/Insert Query Chart` to insert a chart. 2. Write down the options of chart in the child block. Options including: * chart type * width * height * color scheme (optional) * labels of data 3. Write advanced query in grand child block. <!-- --> 1. 使用斜杠命令 `/Insert Query Chart` 插入图表。 2. 在子块中写入图表的一些设置选项。包括: * 图表类型 * 图表宽度 * 图表高度 * 颜色 (可选) * 数据的标签 3. 在子块的子块中写入需要绘图的高级查找。 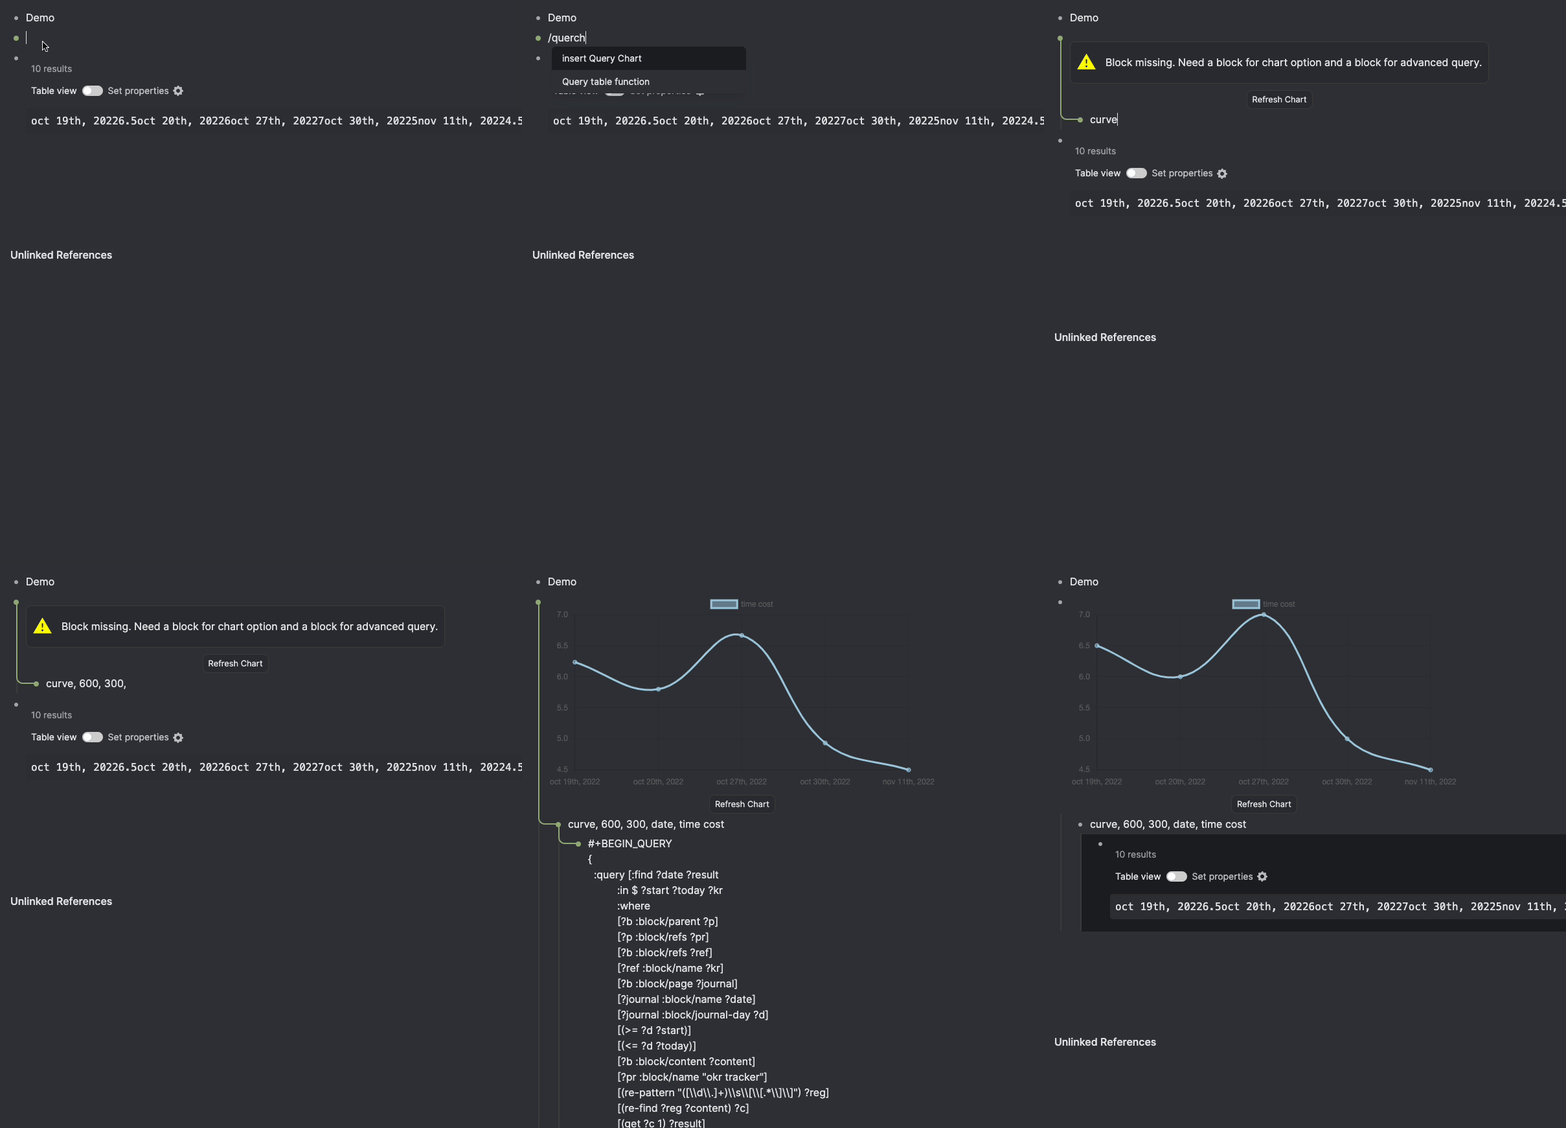 ### Supported chart type (支持的图表类型) * bar (柱状图) <img src="./screenshots/bar.png" width="600"> * pie (饼图) <img src="./screenshots/pie.png" width="600"> * doughnut (环形图) <img src="./screenshots/doughnut.png" width="600"> * line (折线图) <img src="./screenshots/line.png" width="600"> * curve (曲线图) <img src="./screenshots/curve.png" width="600"> ### Color Scheme (配色方案) Check this [link](https://nagix.github.io/chartjs-plugin-colorschemes/colorchart.html) for all supported color schemes. Default color scheme is `brewer.Paired12`. 所有配色方案请参考[此链接](https://nagix.github.io/chartjs-plugin-colorschemes/colorchart.html). 默认配色方案为`brewer.Paired12`。 ### Advanced query (高级查询) You need to write a query whose result is a list of array. Take the following query as an example. 你需要写一个带有数组返回结果的查询。以下面这个查询为例 ```clojure :query [:find ?x ?y :in $ ?start ?today :where [?b :block/content ?x] [?b :block/page ?journal] [?journal :block/journal-day ?d] [(>= ?d ?start)] [(<= ?d ?today)] [?b :block/priority ?y] ] :inputs [:-7d :today] ``` The result would be like `[task1, A], [task2, B], [task3, C], ...` For x-y plot, the first elements in each array formats the data on x-axis. 查询结果将为`[task1, A], [task2, B], [task3, C], ...`。对于x-y形式坐标系的图,第一个元素是横轴的标签。 It is recommended to use the relative date input if you need date/time paremeter. Check the usage in [official document](https://docs.logseq.com/#/page/advanced%20queries) 如果你需要日期或者时间作为查询参数,建议使用相对日期的形式,详见[官方文档](https://docs.logseq.com/#/page/advanced%20queries) ## Example (示例) I have page like the following one. I log the sleep time as `sleep-time [[改善睡眠质量,平均7小时]]` 我有如下形式的页面。我会以`睡眠时间 [[改善睡眠质量,平均7小时]]`的形式记录睡眠时间。 ```markdown ## [[OKR Tracker]] - 6 [[改善睡眠质量,平均7小时]] ``` The query I used to generate a chart for the last 7 days is 我用如下查询绘制过去7天的睡眠时间曲线 ```clojure { :query [:find ?date ?result :in $ ?start ?today ?kr :where [?b :block/parent ?p] [?p :block/refs ?pr] [?b :block/refs ?ref] [?ref :block/name ?kr] [?b :block/page ?journal] [?journal :block/name ?date] [?journal :block/journal-day ?d] [(>= ?d ?start)] [(<= ?d ?today)] [?b :block/content ?content] [?pr :block/name "okr tracker"] [(re-pattern "([\\d\\.]+)\\s\\[\\[.*\\]\\]") ?reg] [(re-find ?reg ?content) ?c] [(get ?c 1) ?result] ] :inputs [:5d-before :today "改善睡眠质量,平均7小时"] } ``` The chart is 图表如下 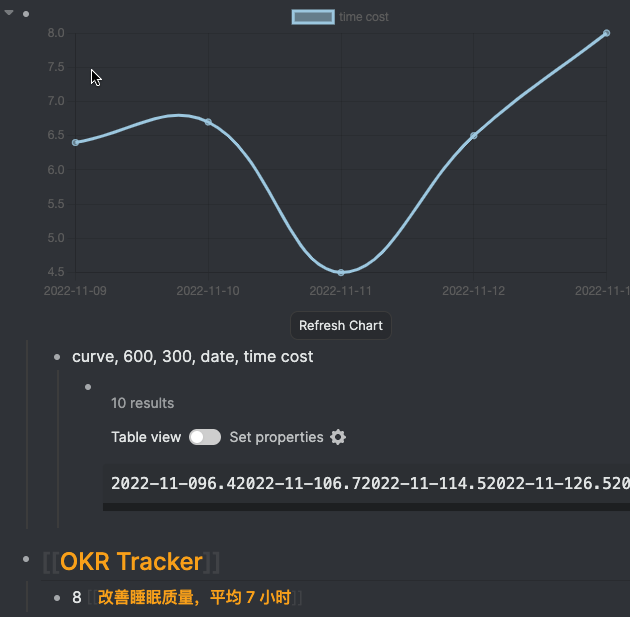 ## TODOs - [ ] Custom colorscheme ## Credit * [Logseq Plugin Starter Vite](https://github.com/vipzhicheng-starter/logseq-plugin-starter-vite) * [chart.js](https://www.chartjs.org/) * [vue-chartjs](https://vue-chartjs.org/) * Inspired by [logseq-chartrender-plugin](https://github.com/hkgnp/logseq-chartrender-plugin) ## Licence MIT
