KO
|
EN
gitlite — search
Search
#python
#react
#typescript
#nodejs
#hacktoberfest
#mongodb
#machine-learning
#javascript
#python3
#reactjs
#github
#vue
jsonld-vis
★ 159
Open GitHub ↗
Turn JSON-LD into pretty graphs
Download README (.md)
Explore Similar Repositories
AzureSDKForRust
:
Microsoft Azure SDK for Rust
ui
:
Talend's unified web UI repository.
ImagePicker
:
Android library to easily pick an image from gallery or camera app. The users can select their prefered gallery/camera app on a unique Intent. Initial gist:
shipkit
:
Toolkit for shipping it used by Mockito library
rules_closure
:
Closure rules for Bazel
// repository documentation
Was this content helpful?
★ 0
(0 ratings)
Select Rating:
★
★
★
★
★
Submit Feedback
Recent Feedback
×
Download README
Do you want to download the
README.md
file for
jsonld-vis
?
Download (.md)
# JSON-LD visualization [](https://github.com/prettier/prettier) Turn JSON-LD into pretty graphs. 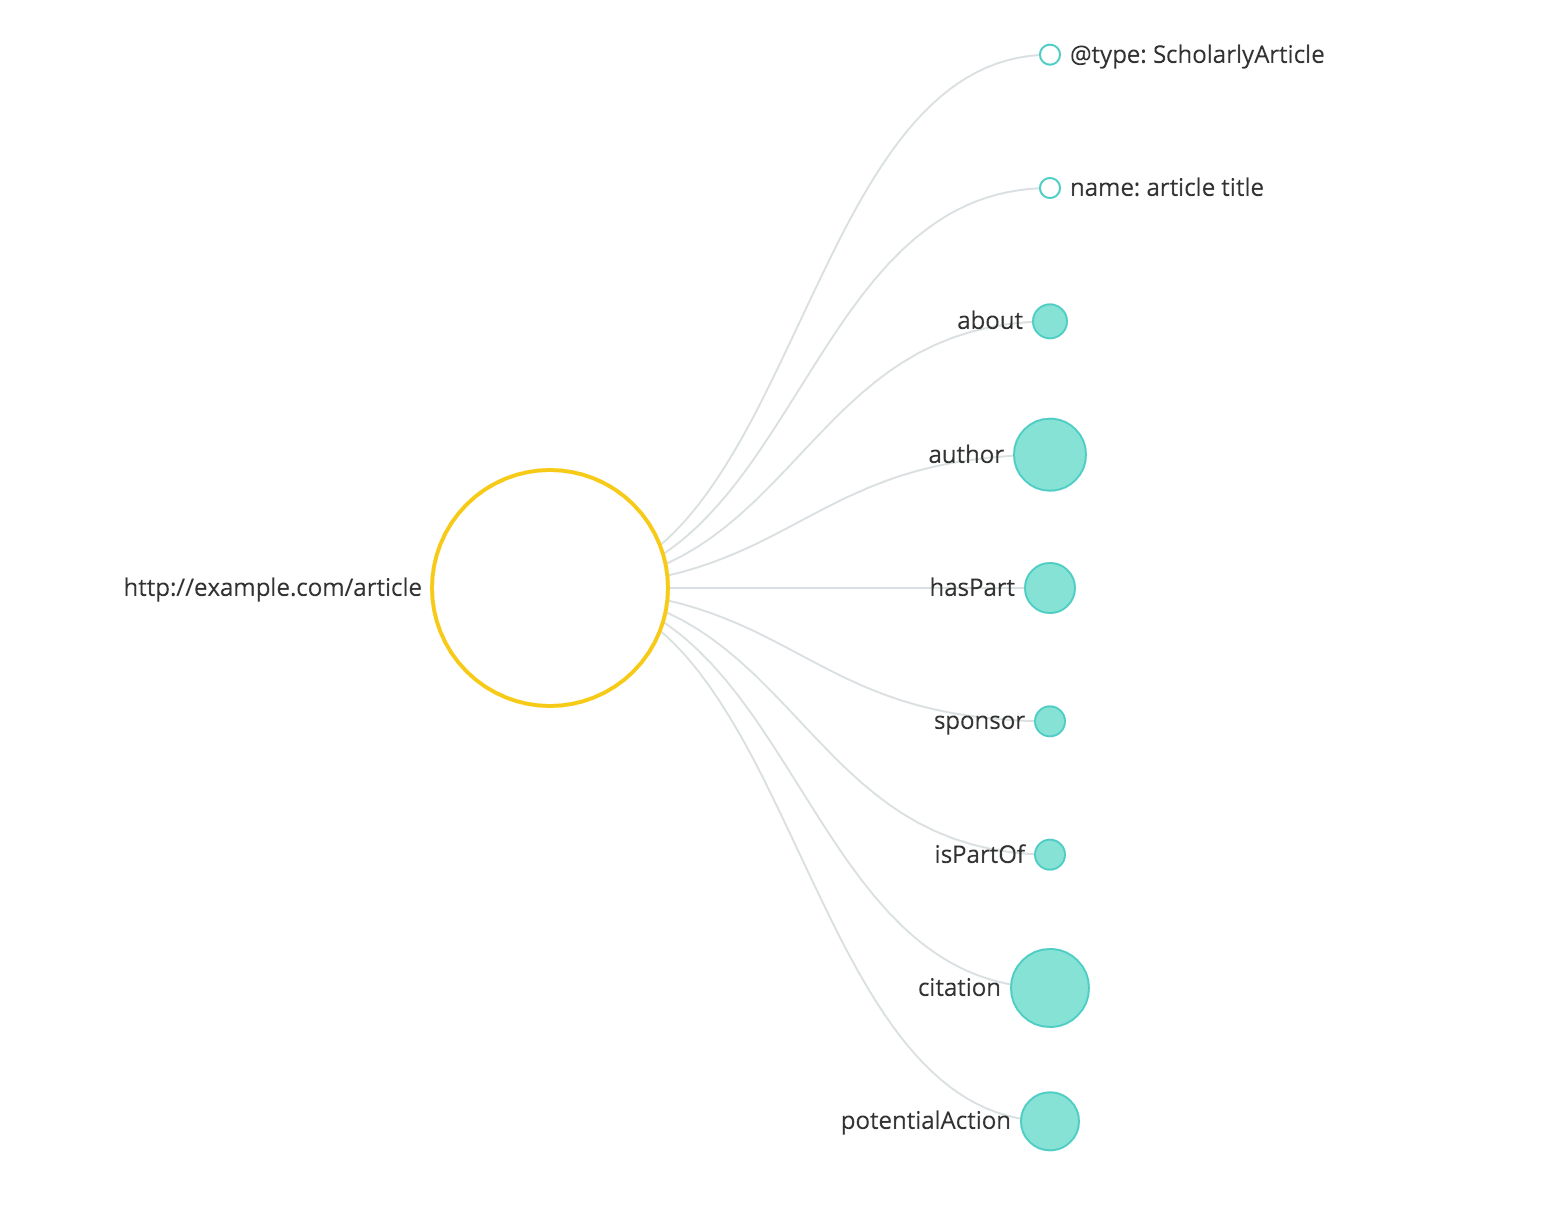 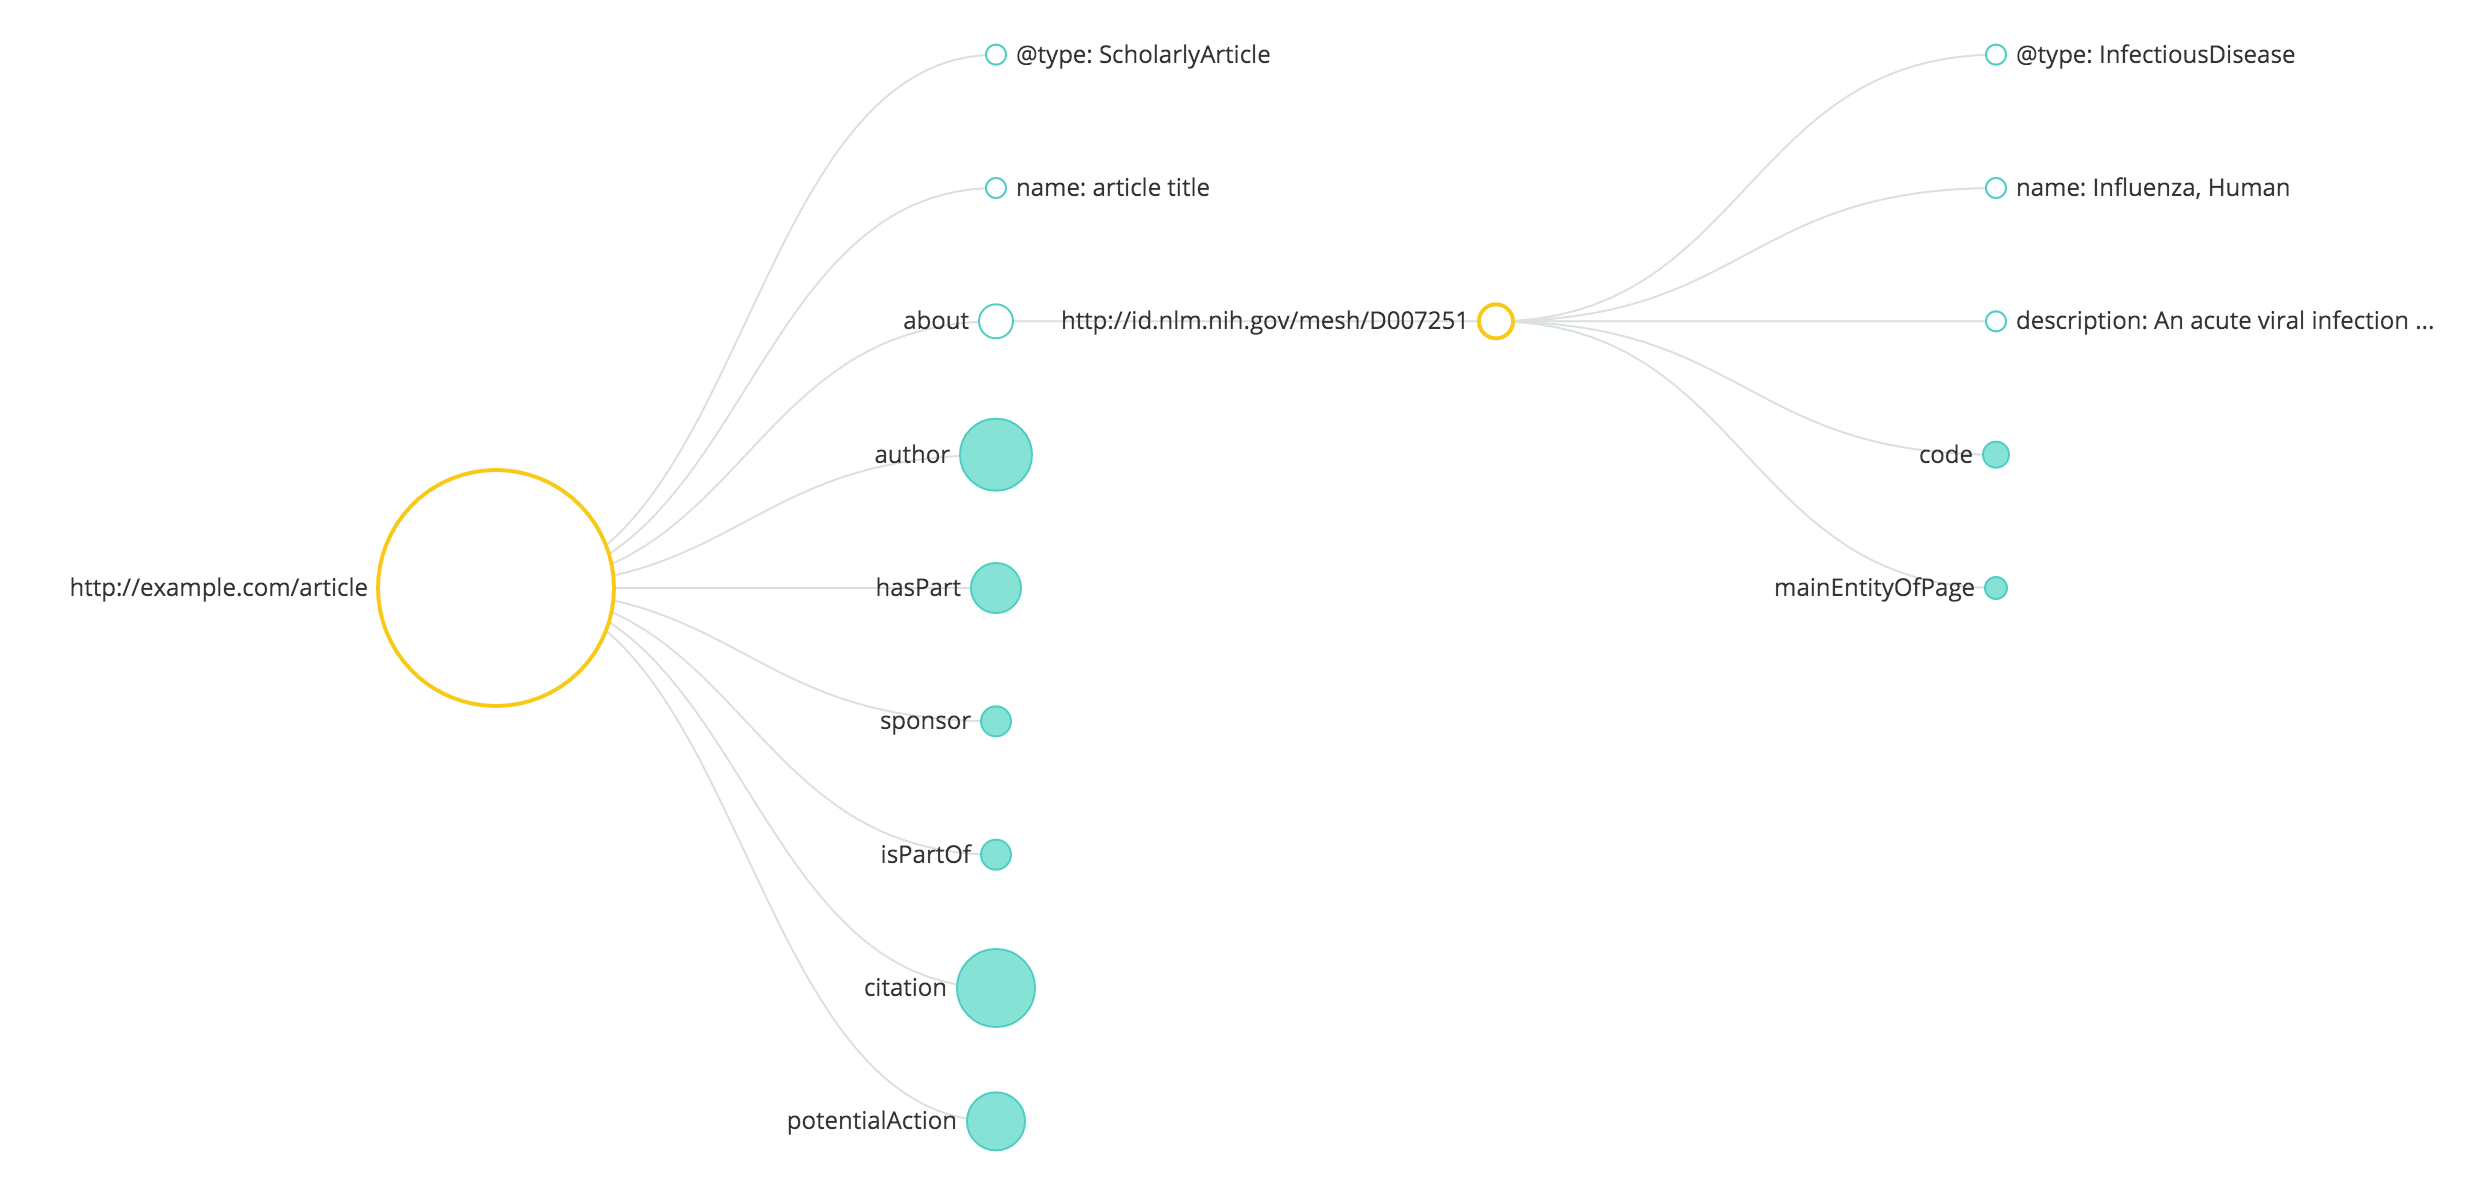 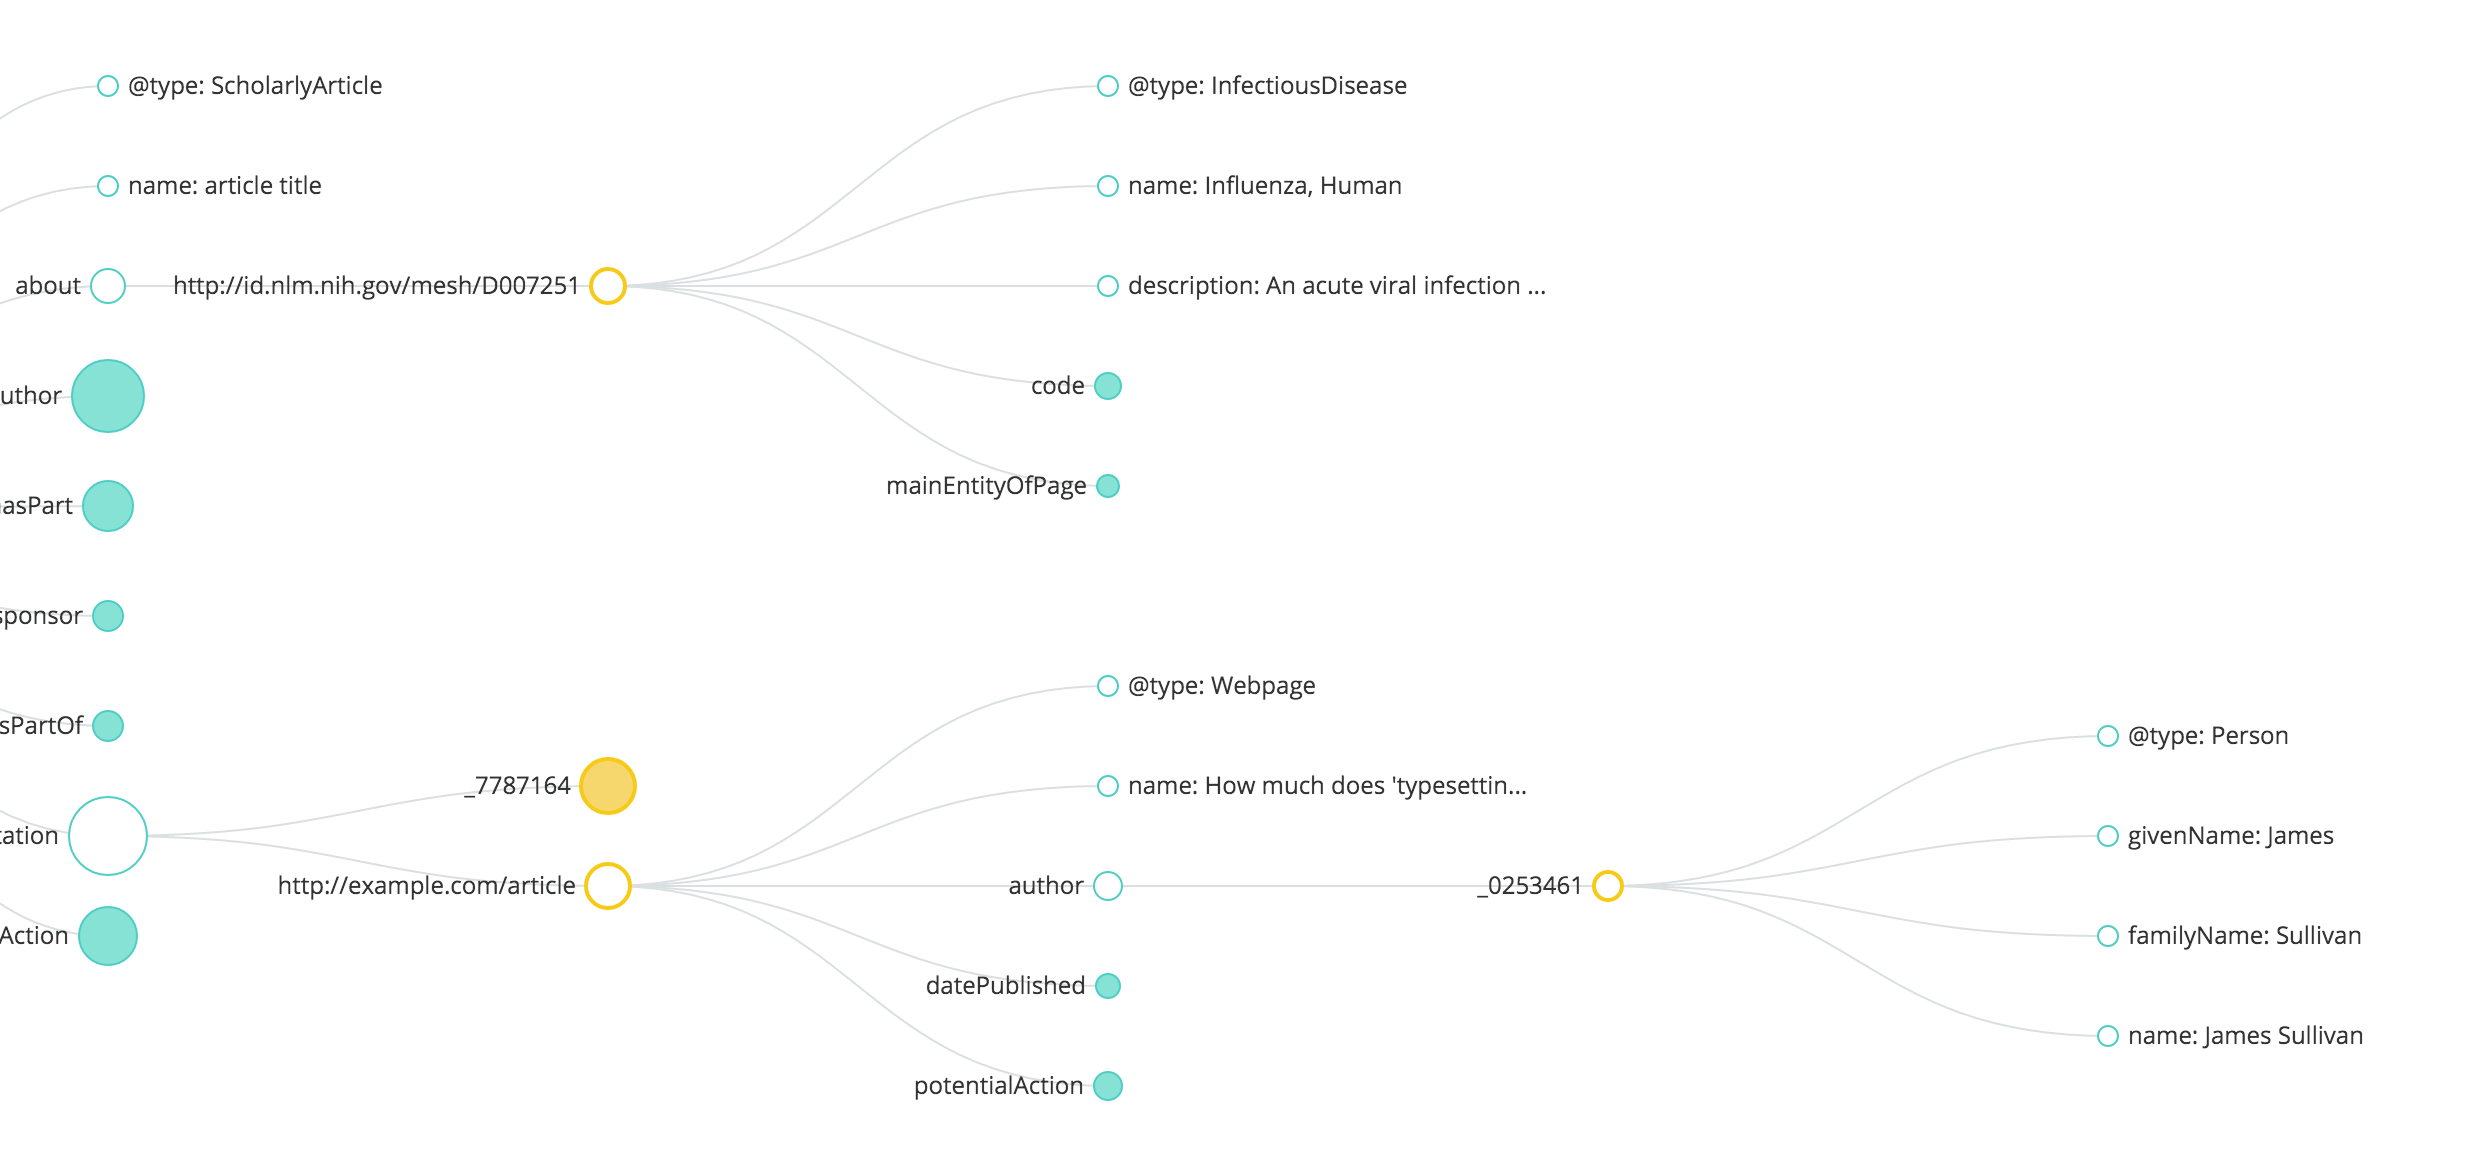 ### Usage See the `examples/` folder for usage details. Import `jsonld-vis.js` and `jsonld-vis.css`. The CSS may look better if 'Open Sans' is available as a font (but it will work without it). To initialize, simply load data into the exported `jsonldVis` function: ```js import d3 from 'd3'; import jsonldVis from 'jsonld-vis'; jsonldVis(d3); d3.json('example.json', (err, data) => { if (err) return console.warn(err); d3.jsonldVis(data, '#graph', { w: 800, h: 600, maxLabelWidth: 250 }); }); ``` #### `d3.jsonldVis(data, querySelector[, config])` Where the optional `config` variable is as follows: ```js { h: 600, // height w: 800, // width maxLabelWidth: 250, // maximum label width transitionDuration: 750, // transition duration, in ms transitionEase: 'cubic-in-out', // transition easing function minRadius: 5 // minimum node radius scalingFactor: 2 // factor to scale node sizes } ``` Specifying the width is just for initialization purposes. The width of the svg element will dynamically be adjusted as necessary. For horizontal auto-scrolling, the specified `querySelector` must have horizontal scroll enabled: ```css query-selector { overflow-x: autho; } ``` For large data, it may be necessary to adjust the scaling so that node sizes still look reasonable. The `scalingFactor` allows adjustment of this - larger values of `scalingFactor` will reduce the maximum node size. Labels that are longer than maximum label width are truncated; hover over the node to see the full label: 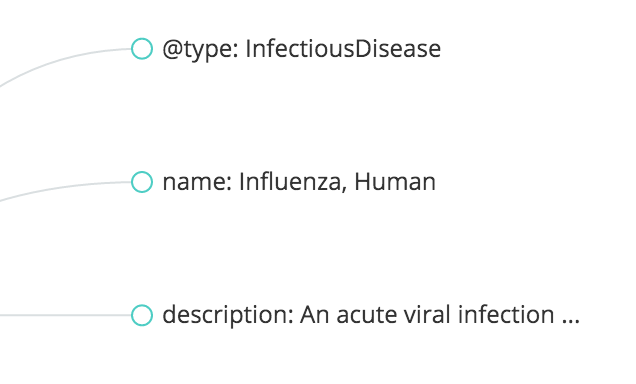 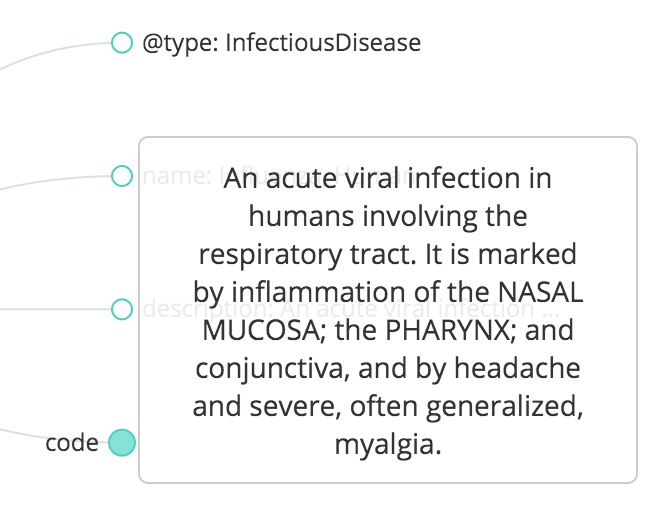 ### License [Apache 2.0](https://github.com/science-periodicals/jsonld-vis/blob/master/LICENSE)
