KO
|
EN
gitlite — search
Search
#javascript
#python
#hacktoberfest
#react
#ai
#typescript
#llm
#go
#golang
#android
#machine-learning
#rust
#deep-learning
#linux
xpu-perf
★ 25
Open GitHub ↗
Continuous profiler for GPU & CPU with eBPF
Download README (.md)
Explore Similar Repositories
hidebusybox
:
Hide Busybox Detection - With Java and Native C/C++
MultiModal-Jupyter-Sandbox
:
Simple code sandbox supporting jupyter notebook style code execution. Used for agent training
touying-sjtu
:
基于 Touying 的上海交通大学 Typst 幻灯片模板 (Typst Slide Theme for SJTU Based on Touying)
GFNet
:
Adapting Dense Matching for Homography Estimation with Grid-based Acceleration (CVPR'25)
KeyboardHero
:
A Visual Studio extension
// repository documentation
Was this content helpful?
★ 0
(0 ratings)
Select Rating:
★
★
★
★
★
Submit Feedback
Recent Feedback
×
Download README
Do you want to download the
README.md
file for
xpu-perf
?
Download (.md)
# xpu-perf: eBPF Performance Profiler for CPU & GPU A performance profiler that combines eBPF CPU tracing with CUPTI GPU monitoring to provide complete visibility into CUDA application performance. Built using eBPF technology for zero-instrumentation profiling with minimal overhead. **WIP, not finished yet!!!** ## Features - **GPU+CPU Unified Profiling**: Three modes - merge (CPU+GPU), GPU-only causality, CPU-only sampling - **eBPF-based Tracing**: Uprobes and CPU sampling for complete execution visibility - **CUPTI Integration**: Real-time GPU kernel tracking with accurate timing - **Symbol Resolution**: Automatic function name resolution with C++ demangling - **Visual Flamegraphs**: Generates interactive SVG flamegraphs showing CPU→GPU causality - **Low Overhead**: < 1% CPU overhead, < 5% GPU overhead using eBPF profiling - **Zero Instrumentation**: No modifications needed to target applications ## Examples CPU & GPU mixed profiling: 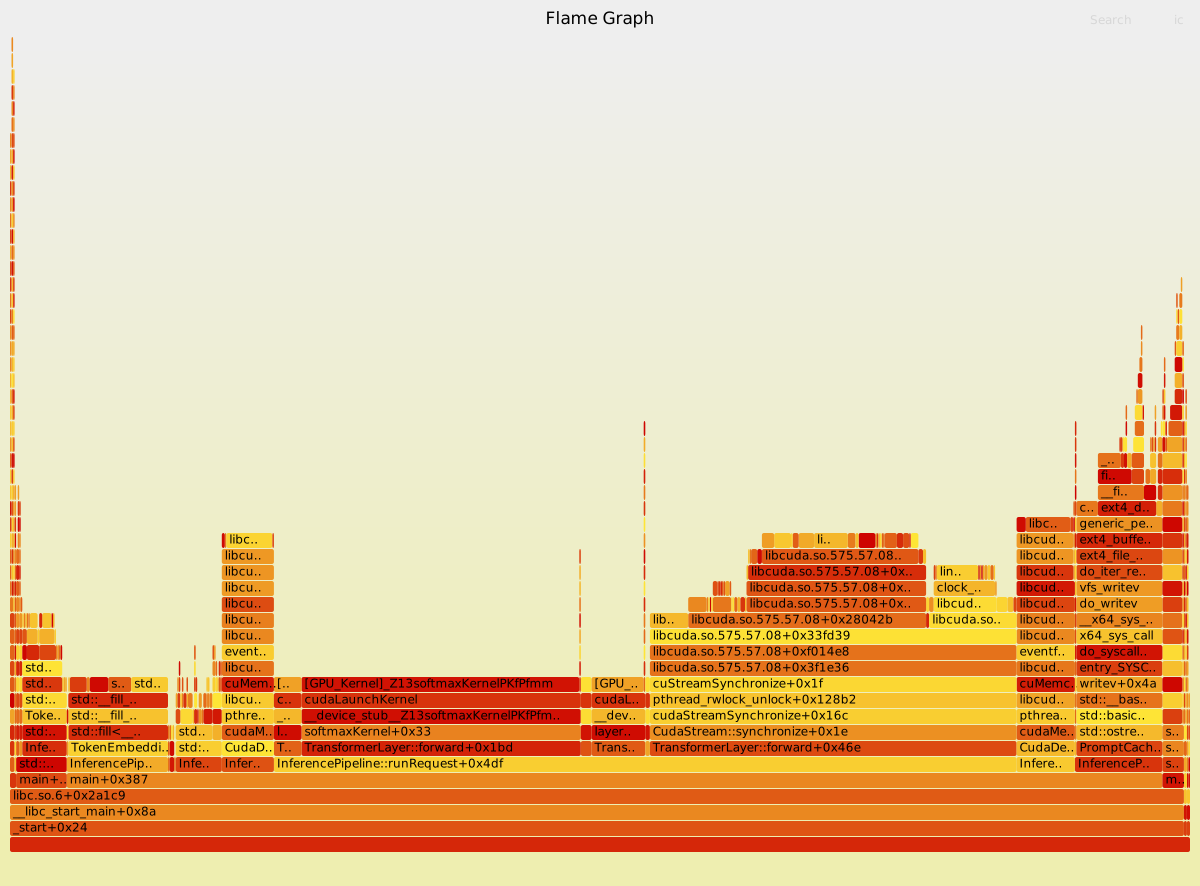 GPU only causality profiling: 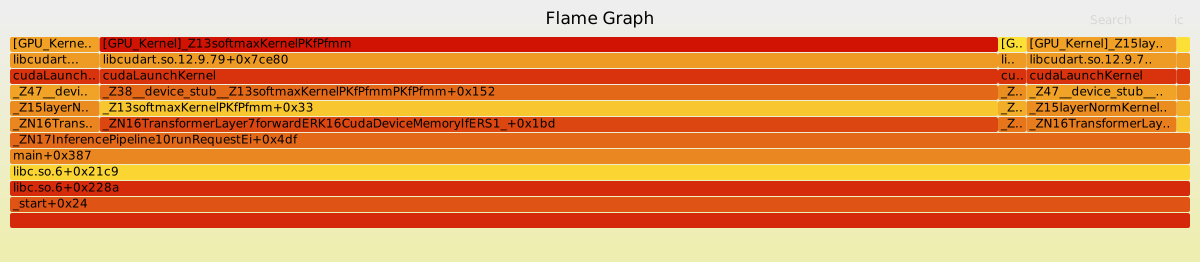 ## Quick Start ### Prerequisites - Linux kernel 5.10+ with eBPF support - Go 1.19+ (for building the profiler) - CUDA Toolkit (for GPU profiling) - Root privileges (for eBPF) - Perl (for flamegraph generation) ### Installation ```bash # Install dependencies sudo apt-get install -y libelf1 libelf-dev zlib1g-dev make clang llvm git perl golang-go # Build the profiler cd profiler && make ``` ### Basic Usage ```bash # Profile a CUDA application (merge mode: CPU + GPU) sudo ./profiler/xpu-perf merge -o output.folded ./your_cuda_app # Generate flamegraph flamegraph.pl output.folded > output.svg ``` ## Understanding the Flamegraphs - **CPU stacks**: Show where CPU time is spent during execution - **GPU kernel stacks**: Show GPU execution with CPU call context - **Width**: Represents relative time spent in each function - **Height**: Shows call stack depth - **Interactive**: Click on frames to zoom, search for functions ## GPU+CPU Profiling For CUDA applications, use the integrated profiler with three modes: ```bash # Build the profiler make # Merge mode: CPU sampling + GPU kernels with call stacks sudo ./profiler/xpu-perf merge -o merged_trace.folded ./your_cuda_app # GPU-only: CPU→GPU causality (shows which CPU code launched kernels) sudo ./profiler/xpu-perf gpu -o gpu_trace.folded ./your_cuda_app # CPU-only: Pure CPU sampling without GPU overhead sudo ./profiler/xpu-perf cpu -o cpu_trace.folded ./your_cuda_app # Generate flamegraph perl profiler/flamegraph.pl merged_trace.folded > flamegraph.svg # View detailed documentation cat profiler/README.md ``` ## Testing Test the profiler with included examples: ```bash # Test with simple CUDA vectorAdd program sudo -E env "PATH=$PATH" ./profiler/xpu-perf cpu -o vectoradd.folded test/mock-app/vectorAdd perl profiler/flamegraph.pl vectoradd.folded > vectoradd-flamegraph.svg # Test with PyTorch workload (requires Python with PyTorch) sudo -E env "PATH=$PATH" ./profiler/xpu-perf gpu -o pytorch.folded python3 test/pytorch/pytorch_longer.py perl profiler/flamegraph.pl pytorch.folded > pytorch-flamegraph.svg ``` The output flamegraphs show: - Complete CPU→GPU call chains with symbolized function names - Python interpreter frames and user code (for PyTorch) - PyTorch/libtorch C++ function symbols - CUDA runtime and driver function calls - GPU kernel names and execution times ## Architecture The profiler combines eBPF-based tracing with CUPTI GPU monitoring: 1. **eBPF uprobes**: Captures CPU call stacks at `cudaLaunchKernel` - Tracks which CPU code launches GPU kernels - Provides CPU→GPU causality chain 2. **eBPF CPU sampling**: Periodic stack trace sampling at 50 Hz - Captures CPU execution activity - Low overhead profiling 3. **CUPTI integration**: Real-time GPU kernel tracking - Monitors GPU kernel launches and execution - Provides accurate GPU timing via named pipes - JSON-formatted event stream 4. **Correlation engine**: Matches CPU stacks with GPU kernels - Uses correlation IDs and timestamps - Converts GPU duration to sample counts - Generates unified folded stack output ## Performance Considerations - **Sampling Frequency**: Default 50 Hz for CPU sampling - Balanced overhead vs accuracy - GPU time converted to equivalent samples - **Overhead**: - CPU sampling: < 1% overhead - CUPTI tracing: < 5% overhead for most workloads - Zero instrumentation required - **Profiling modes**: - Merge mode: Best for understanding complete CPU+GPU workflow - GPU-only: Minimal overhead, shows GPU causality - CPU-only: No GPU overhead, pure CPU profiling ## License MIT License ## Acknowledgments - Built on eBPF technology for efficient kernel-level profiling - Uses Brendan Gregg's FlameGraph visualization - Inspired by Linux performance analysis tools
