KO
|
EN
gitlite — search
Search
#python
#java
#python3
#arduino
#golang
#machine-learning
#rust
#html
#flask
#javascript
#seismology
#nodejs
swemaps
★ 16
Open GitHub ↗
Swedish map data for ggplot and leaflet in R
Download README (.md)
Explore Similar Repositories
glulx-typescript
:
Glulx VM in TypeScript with Channel IO
Fingerprint
:
仿支付宝指纹解锁 可进行密码验证
avr-gameboy-cam
:
Automatically exported from code.google.com/p/avr-gameboy-cam
react-treeview-recursive
:
Example of recursive tree view in ReactJS
create-lp-design
:
Create Landing Page Design
// repository documentation
Was this content helpful?
★ 0
(0 ratings)
Select Rating:
★
★
★
★
★
Submit Feedback
Recent Feedback
×
Download README
Do you want to download the
README.md
file for
swemaps
?
Download (.md)
## swemaps **Swedish map data for ggplot and leaflet in R** ```{r} # install.packages('devtools') devtools::install_github('reinholdsson/swemaps') ``` ### Datasets - `map_ln`: regions polygon data - `map_kn`: municipalities polygon data - `cent_ln`: regions centroids data - `cent_kn`: municipalities centroids data ### Examples #### ggplot2 ```{r} library(ggplot2) library(swemaps) library(rkolada) # devtools::install_github("reinholdsson/rkolada") # function to merge kolada data with map data from swemaps prepare_map_data <- function(x) { x$knkod <- x$municipality.id data <- merge(map_kn, x, by = 'knkod') data[order(data$order),] # make sure it's sorted by "order" column } # rkolada conn a <- rkolada::rkolada() # Get data from Kolada x <- a$values('N00941', year = 2010) # make sure "kpi.municipality_type == 'K'" x <- prepare_map_data(x) # Plot it! ggplot(x, aes_string('ggplot_long', 'ggplot_lat', group = 'knkod', fill = 'value')) + geom_polygon() + coord_equal() ``` 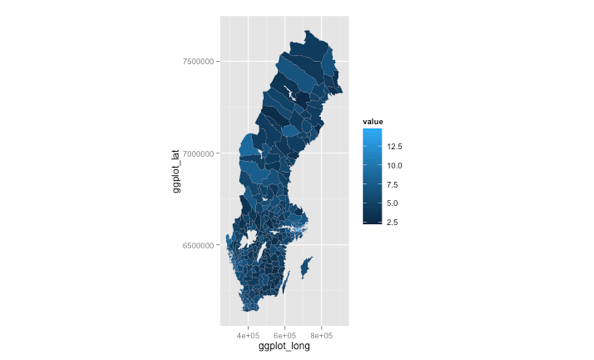 ```{r} x <- a$values('N00941', c('1440', '0604', '2505', '2084'), year = 2010, all.cols = T) x <- prepare_map_data(x) ggplot(x, aes_string('ggplot_long', 'ggplot_lat', group = 'knkod', fill = 'value')) + geom_polygon() + coord_equal() + facet_wrap(~municipality.title, scales = 'free', ncol = 2) + theme_bw() ``` 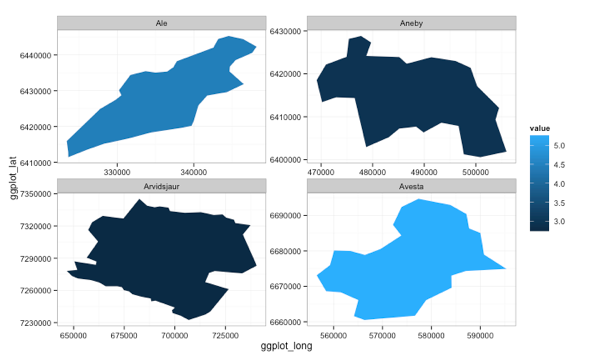 #### leaflet https://rstudio.github.io/leaflet/ ```{r} library(leaflet) # devtools::install_github("rstudio/leaflet") x <- map_kn m <- leaflet() %>% addTiles() for (kn in unique(x$knkod)) { i <- x[x$knkod == kn,] m <- m %>% addPolygons(i$leaflet_long, i$leaflet_lat, color = 'blue', weight = 1) } m # plot! ``` 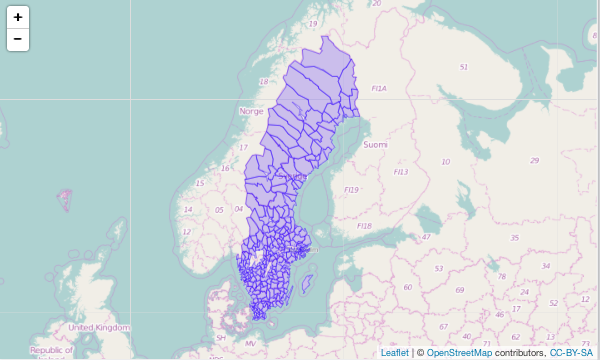 with coloured areas: ```{r} library(plotrix) x <- a$values('N01963', year = 2010) x <- subset(x, gender == 'T') x <- prepare_map_data(x) x$color <- substring(color.scale(x$value, c(1,1,0), c(0,1,1), 0), 1, 7) m <- leaflet() %>% addTiles() for (kn in unique(x$knkod)) { i <- x[x$knkod == kn,] m <- m %>% addPolygons(i$leaflet_long, i$leaflet_lat, color = i$color[[1]], weight = 1) } m ``` 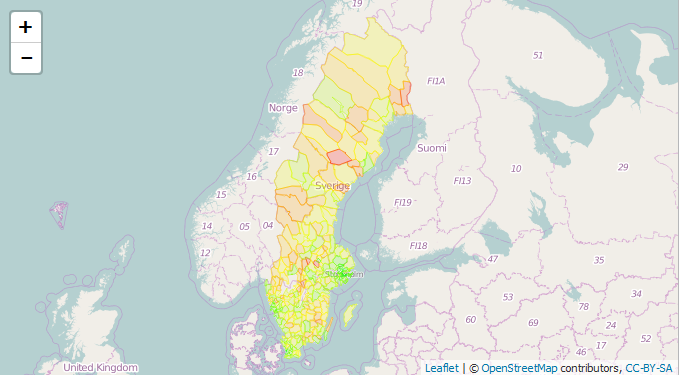 ### Source arcgis (Kommungränser_SCB_07, Länsgränser_SCB_07), SCB
