KO
|
EN
gitlite — search
Search
#python
#java
#python3
#arduino
#golang
#machine-learning
#rust
#html
#flask
#javascript
#seismology
#nodejs
zabbix-impersonator
★ 12
Open GitHub ↗
zabbix to prometheus adapter
Download README (.md)
Explore Similar Repositories
Minimal_E-Bike_Torquesensor_Precontroller
:
based on a digispark
gameoflife
:
Conway's Game of Life, in PyTorch, using convolutions
ribbot
:
Script for querying merged PRs, open issues, and closed issues from config repos.
ExplorerPy
:
A software for mapping energy landscape with a variety of methods, using classical potentials. Based on the LAMMPS MD package.
delay-schedule
:
分布式、高可用的延迟调度系统、可以配合消息队列实现延迟任务队列
// repository documentation
Was this content helpful?
★ 0
(0 ratings)
Select Rating:
★
★
★
★
★
Submit Feedback
Recent Feedback
×
Download README
Do you want to download the
README.md
file for
zabbix-impersonator
?
Download (.md)
# Zabbix Impersonator ## Overview This is a go server that implements the zabbix sender protocol [[1]](https://www.zabbix.com/documentation/3.4/manual/appendix/items/trapper) [[2]](https://www.zabbix.com/documentation/3.4/manual/appendix/protocols/header_datalen). It listens on two ports: * TCP port 10051 to listen to zabbix_sender requests. * HTTP `/metrics` port 2112 to expose the Prometheus metrics. The server is configured by a `metrics.json` file that contains the allowed zabbix metrics. All `zabbix_sender` requests received by the server that have a matching entry in `metrics.json` will be exposed via the `/metrics` interface on port 2112. All other metrics will be ignored. ## Demo 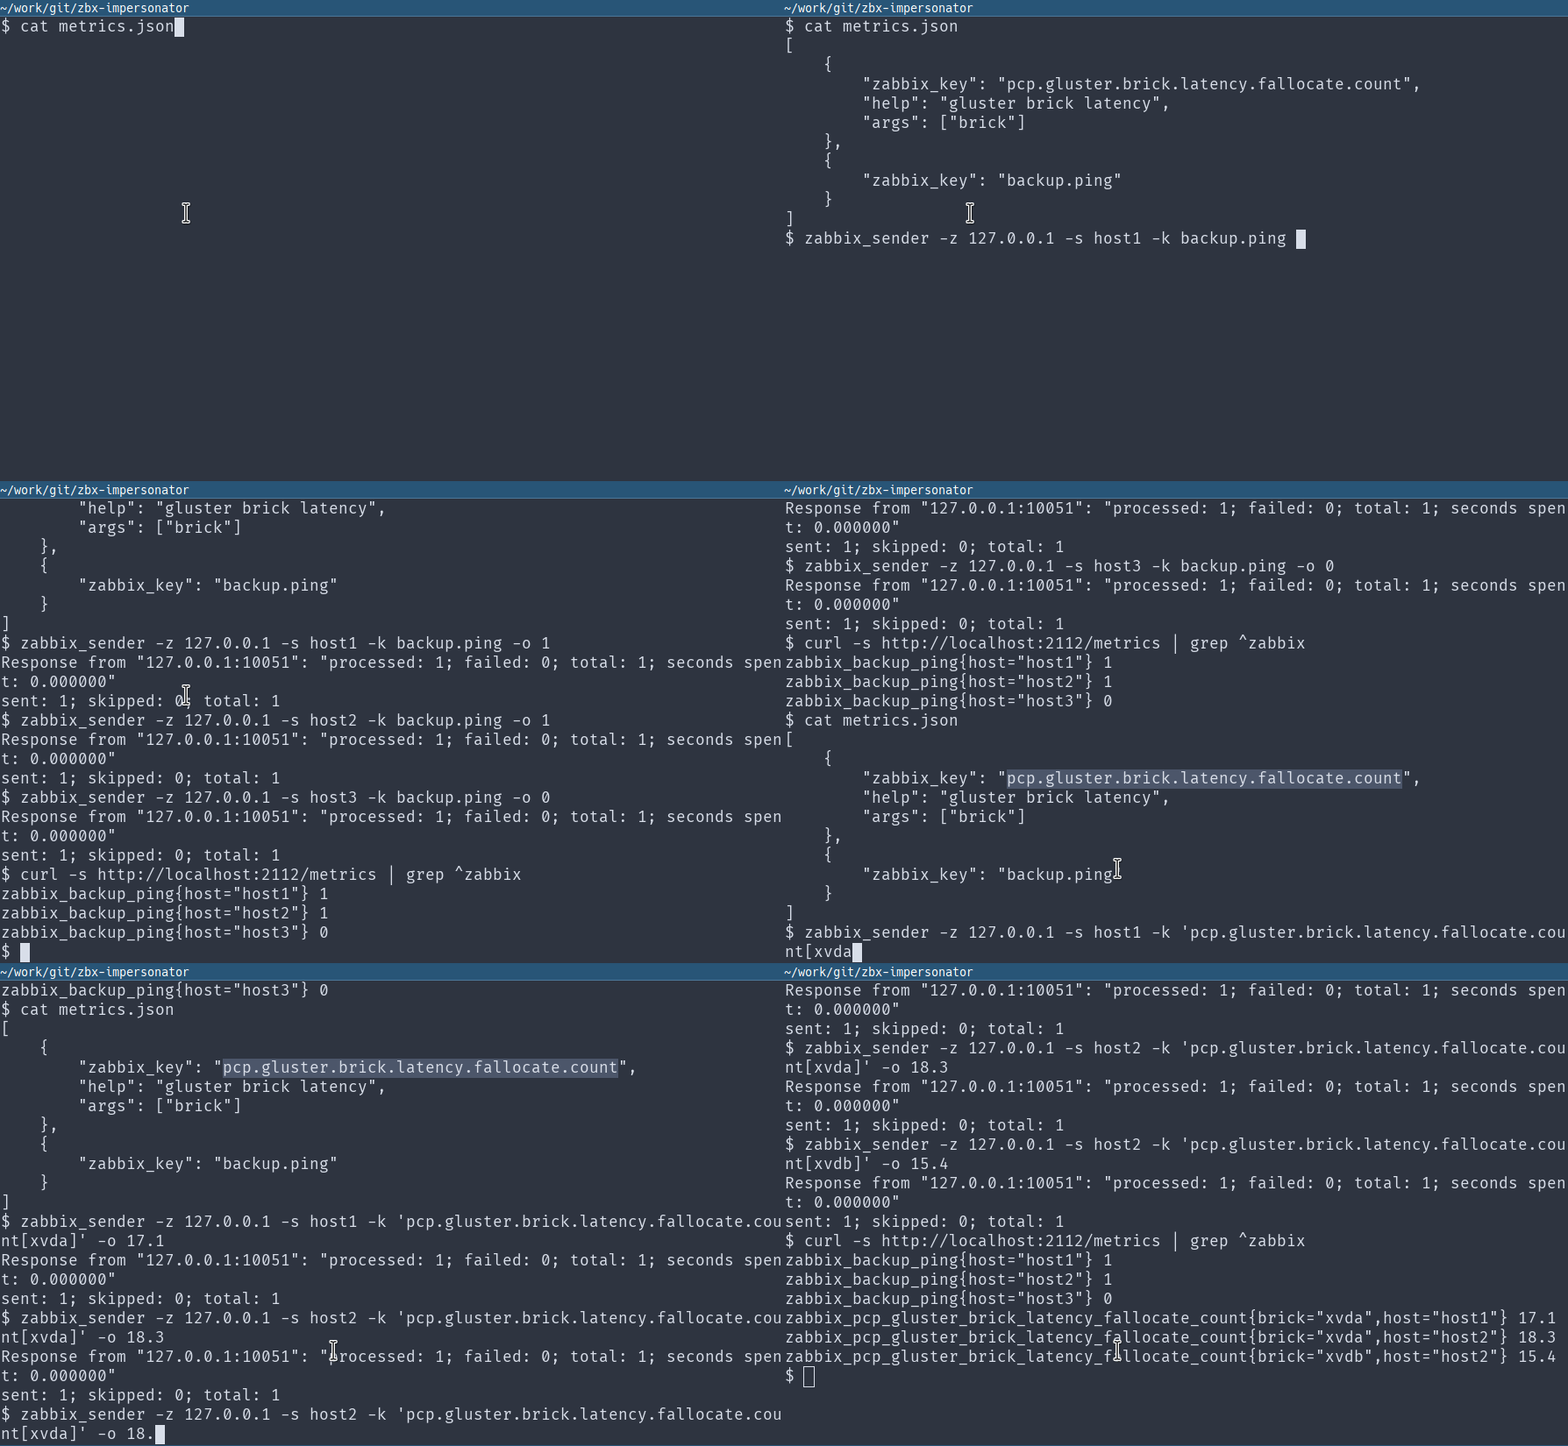 ## `metrics.json` The `metrics.json` file is an array of metrics that will be accepted by the server. Each metric supports the following arguments: * `zabbix_key`: (mandatory) key name sent by the zabbix client. It corresponds to the `key name` defined in [this document](https://www.zabbix.com/documentation/3.4/manual/config/items/item/key). The `parameters` section (including the square brackets) must **not** appear in this field. * `metric`: (optional) the name of the metric as exposed by the Prometheus client. If not defined, it will default to `zabbix_<sanitized_key_name>` (where the `sanitized_key_name` is the `key_name` after replacing all `.` occurrences with `_`). * `help`: (optional) help string for the metric exposed by the Prometheus client. * `args`: (optional) array of parameters as defined in [this document](https://www.zabbix.com/documentation/3.4/manual/config/items/item/key). If defined the zabbix client must send the metric with the `parameters` (including the square bracket) otherwise it will be skipped. This arguments will be defined as labels in the Prometheus metrics. ## Limitations * The only metric kind currently supported is a GaugeVec. * All values are parsed as float64. * The Clock value for a trapper item is ignored. * By design it only supports trapper items. ## Internal Prometheus metrics * `processed_requests`: (counter) total number of processed zabbix_sender requests * `invalid_requests`: (counter) total number of invalid zabbix_sender requests * `processed_trapper_items`: (counter) total number of processed trapper items * `skipped_trapper_items`: (counter) total number of skipped trapper items ## Future enhancements * Add configuration file / cli parameters: zabbix host, port, zabbix server port, metrics json file path, etc. * Add a cache for unknown metrics in order to expose them via internal prometheus metrics. * Better logging.
