KO
|
EN
gitlite — search
Search
#python
#java
#python3
#arduino
#golang
#machine-learning
#rust
#html
#flask
#javascript
#seismology
#nodejs
k8s-autoscale
★ 23
Open GitHub ↗
Kubernetes Autoscaling Experiments
Download README (.md)
Explore Similar Repositories
talks
:
Repository of talks I've given
figma-mac
:
A Mac client for Figma
eru-metric
:
send container metric to anywhere you want
vertx-eventbus-java
:
A Vert.x EventBus client written in Java, works on Android
leapfrog-triejoin
:
High-performance (C++) implementation of the leapfrog-triejoin algorithm by Todd Veldhuizen (http://arxiv.org/abs/1210.0481)
// repository documentation
Was this content helpful?
★ 0
(0 ratings)
Select Rating:
★
★
★
★
★
Submit Feedback
Recent Feedback
×
Download README
Do you want to download the
README.md
file for
k8s-autoscale
?
Download (.md)
# Autoscaling With the version 1.1 of Kubernetes a cool new feature called [Horizontal Pod Autoscaler](http://kubernetes.io/v1.1/docs/user-guide/horizontal-pod-autoscaler.html) or simply autoscaler has been introduced. It is implemented as a control loop, periodically querying the CPU utilization of pods under management of a certain RC. It takes the average of the CPU utilization and adjusts the replica count of the RC to match the desired target CPU utilization in the RC. The underlying [autoscaling algorithm](http://kubernetes.io/v1.1/docs/design/horizontal-pod-autoscaler.html#autoscaling-algorithm) is as follows: - The observation period of the autoscaler is controlled by `--horizontal-pod-autoscaler-sync-period` and defaults to 30 sec. - The CPU utilization is the average CPU usage of a pod across the last minute divided by the CPU requested by the pod. - Currently, the CPU usage is taken directly from Heapster (see also below). In future, there will be an API on the master for this, see also PR <a href="https://github.com/kubernetes/kubernetes/pull/11951">11951</a>). The target number of pods is calculated from the following formula: TargetNumOfPods = ceil(sum(CurrentPodsCPUUtilization) / Target) Since starting/stopping pods usually introduces noise to the metric, after each action, the autoscaler should wait some time for reliable data. The scale conditions are: - Scale-up can only happen if there was no rescaling within the last 3 minutes. - Scale-down will wait for 5 minutes from the last rescaling. Note that any scaling will only be made if `avg(CurrentPodsConsumption)/Target` drops below 0.9 or increases above 1.1, that is, a 10% tolerance. This has the benefit that if new user load appears the number of pods can grow rapidly and user requests are not rejected, while lowering the number of pods is not that urgent. This strategy further avoids thrashing, that is, prevents rapid execution of conflicting decision if the load is not stable. ## Environment To test the autoscale I chose a Google Cloud Platform (GCP) setup, using the [Google Cloud Shell](https://cloud.google.com/cloud-shell/docs/): 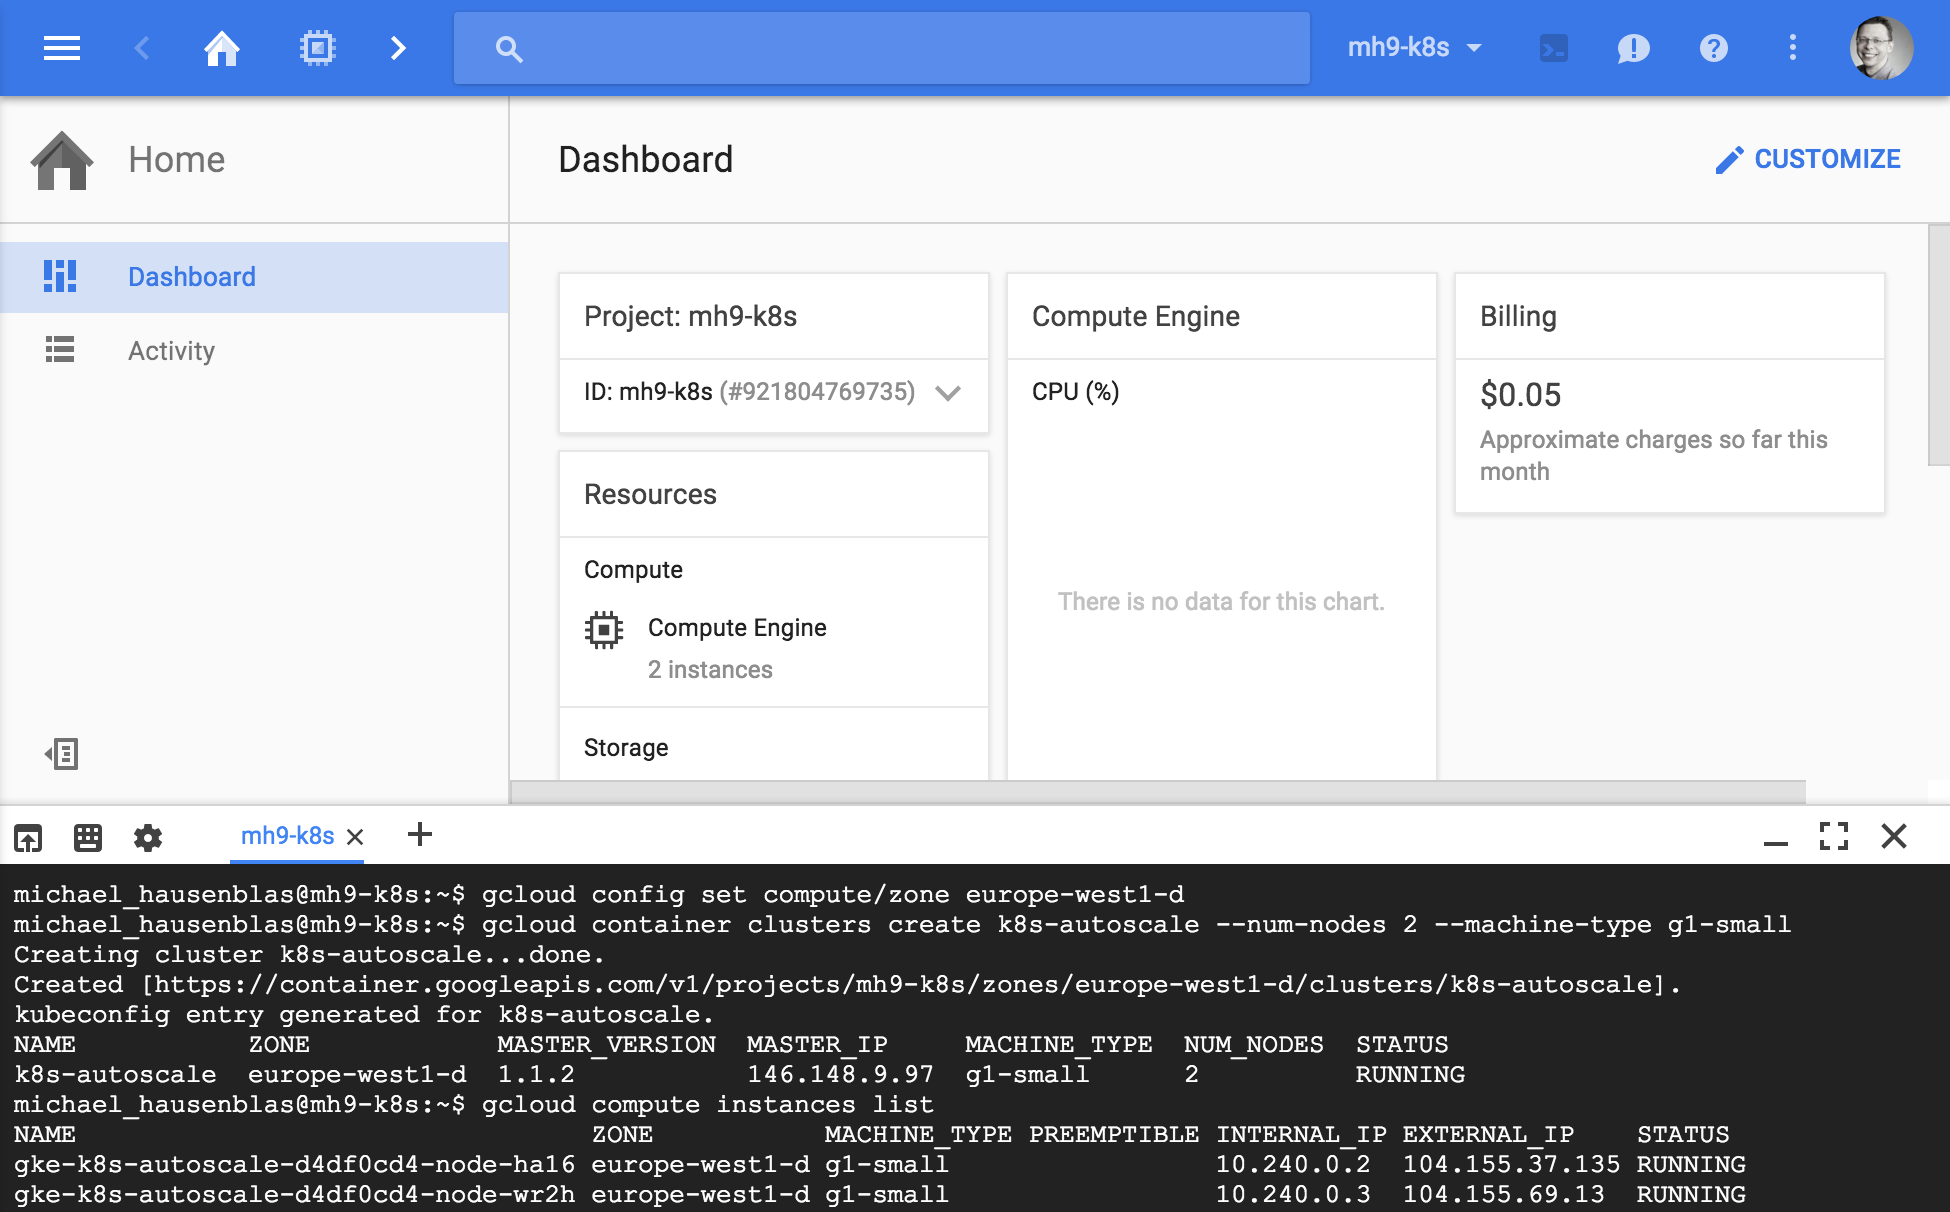 To ramp up the [Google Container Engine](https://cloud.google.com/container-engine/) (GKE) cluster I did: $ gcloud config set compute/zone europe-west1-d $ gcloud container clusters create k8s-autoscale --num-nodes 2 --machine-type g1-small Creating cluster k8s-autoscale...done. Created [https://container.googleapis.com/v1/projects/mh9-k8s/zones/europe-west1-d/clusters/k8s-autoscale]. kubeconfig entry generated for k8s-autoscale. NAME ZONE MASTER_VERSION MASTER_IP MACHINE_TYPE NUM_NODES STATUS k8s-autoscale europe-west1-d 1.1.2 104.155.48.64 g1-small 2 RUNNING $ gcloud compute instances list NAME ZONE MACHINE_TYPE PREEMPTIBLE INTERNAL_IP EXTERNAL_IP STATUS gke-k8s-autoscale-2f81153f-node-4fi0 europe-west1-d g1-small 10.240.0.3 146.148.18.185 RUNNING gke-k8s-autoscale-2f81153f-node-igvf europe-west1-d g1-small 10.240.0.2 104.155.17.78 RUNNING And after the experiment I would get rid of the 2-node cluster like so: $ gcloud container clusters delete k8s-autoscale ## Test Setup ### Monitoring To monitor the test I used [heapster](https://github.com/kubernetes/heapster) which comes pre-installed on GCP: $ kubectl get services --all-namespaces NAMESPACE NAME CLUSTER_IP EXTERNAL_IP PORT(S) SELECTOR AGE default kubernetes 10.239.240.1 <none> 443/TCP <none> 16m kube-system default-http-backend 10.239.242.22 nodes 80/TCP k8s-app=glbc 16m kube-system heapster 10.239.245.222 <none> 80/TCP k8s-app=heapster 16m kube-system kube-dns 10.239.240.10 <none> 53/UDP,53/TCP k8s-app=kube-dns 16m kube-system kube-ui 10.239.254.106 <none> 80/TCP k8s-app=kube-ui 16m $ kubectl cluster-info Kubernetes master is running at https://146.148.9.97 GLBCDefaultBackend is running at https://146.148.9.97/api/v1/proxy/namespaces/kube-system/services/default-http-backend Heapster is running at https://146.148.9.97/api/v1/proxy/namespaces/kube-system/services/heapster KubeDNS is running at https://146.148.9.97/api/v1/proxy/namespaces/kube-system/services/kube-dns KubeUI is running at https://146.148.9.97/api/v1/proxy/namespaces/kube-system/services/kube-ui In order to visualize the data I was using the native stackdriver-powered Google [Cloud Monitoring](https://app.google.stackdriver.com/). This needs to be enabled separately. Following the [instructions](https://github.com/kubernetes/heapster/blob/master/docs/google.md) I arrived at this: 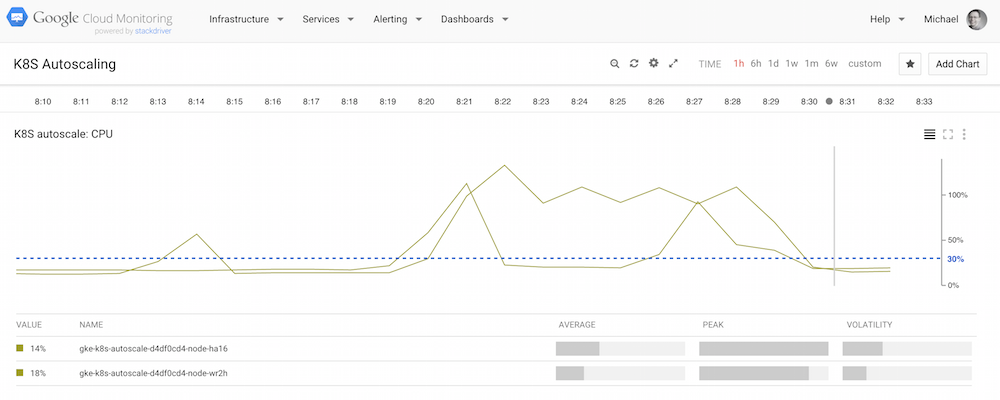 ### System Under Test The system under test (SUT) is a simple [CPU cycle burner](cpu-burner.js) and here is how it can be run locally, with Docker: $ wget -O b.js -q https://raw.githubusercontent.com/mhausenblas/k8s-autoscale/master/cpu-burner.js $ docker run -v "$PWD":/usr/src/app -w /usr/src/app node:4.2.2 node b.js Now, in order to perform the autoscaler test we first create the CPU burner RC and service: $ kubectl create -f cpu-burner-server-svc.yaml $ kubectl create -f cpu-burner-server-rc.yaml The service is now available via `$BASE_URL/service/kubernetes/api/v1/proxy/namespaces/default/services/burner-svc/` producing output such as: I burned 164136709 cycles Next, let's [autoscale](http://kubernetes.io/v1.1/docs/user-guide/kubectl/kubectl_autoscale.html) the CPU cycle burner RC: $ kubectl autoscale rc burner --max=3 --cpu-percent=30 The above means: please scale the burner RC up to three replicas for a target average CPU utilization of 30%, per pod. Note that, as usual, you can list autoscalers with `kubectl get hpa` and get detailed description about one with `kubectl describe hpa`. ### Load Generator Next, we need to generate some load. For the load generator I used [bnorrin/docker-boom](https://hub.docker.com/r/bnorrin/docker-boom/), a containerized version of the popular [boom](https://github.com/tarekziade/boom) load tester. I 'borrowed' the idea to use boom for load testing from <a href="https://github.com/kelseyhightower/">Kelsey</a>. First we need to figure where the CPU cycle burner server is available within the cluster: $ kubectl get svc NAME CLUSTER_IP EXTERNAL_IP PORT(S) SELECTOR AGE burner-svc 10.239.255.45 <none> 8002/TCP app=burner-server 3m kubernetes 10.239.240.1 <none> 443/TCP <none> 1h In our case, it is serving on the node with the IP `10.239.255.45`, and with that we set up the load generator RC: ... containers: - image: bnorrin/docker-boom name: boom command: ["/bin/sh","-c"] args: ["while true ; do boom http://10.239.255.45:8002/ -c 10 -n 100 ; sleep 1 ; done"] ... Above means: let's have 10 concurrent users and 100 requests each. And now we launch the load generator: $ kubectl create -f load-gen-rc.yaml ## The Test The test started at 8:18am and lasted some 12min: 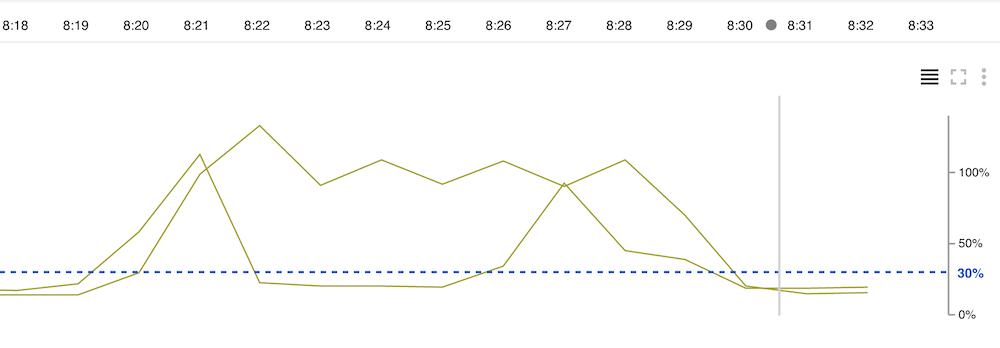 Here's the sequence of the pod scaling of the CPU burner RC: $ kubectl get pods NAME READY STATUS RESTARTS AGE burner-o128a 1/1 Running 0 12m $ kubectl get pods NAME READY STATUS RESTARTS AGE burner-9sb99 1/1 Running 0 58s burner-o128a 1/1 Running 0 14m burner-x5l4d 1/1 Running 0 58s lg-vh8e0 0/1 Pending 0 1m $ kubectl get pods NAME READY STATUS RESTARTS AGE burner-9sb99 1/1 Running 0 1m burner-o128a 1/1 Running 0 15m burner-x5l4d 1/1 Running 0 1m lg-vh8e0 1/1 Terminating 0 1m $ kubectl get pods NAME READY STATUS RESTARTS AGE burner-9sb99 1/1 Running 0 3m burner-o128a 1/1 Running 0 17m burner-x5l4d 1/1 Running 0 3m $ kubectl get pods NAME READY STATUS RESTARTS AGE burner-9sb99 1/1 Running 0 5m burner-o128a 1/1 Running 0 18m burner-x5l4d 1/1 Running 0 5m michael_hausenblas@mh9-k8s:~/k8s-autoscale$ kubectl get pods NAME READY STATUS RESTARTS AGE burner-9sb99 1/1 Running 0 7m As you can see from above, once the load generator starts to put pressure on the RC the autoscaler notices it and scales up to the max. specified three pods. After a while, after the load has gone away for more than 5min, the autoscaler brings back the replica count to one again. All seems to work as expected. For the future, I would love to see the tresholds configurable and/or with plug-able autoscaler policies as well as considering other metrics in addition to the CPU utilization.
