KO
|
EN
gitlite — search
Search
#javascript
#ruby
#dotfiles
#java
#php
#shell
#game
#hacktoberfest
#c-plus-plus
#nodejs
#unmaintained
#vim
dtrace-py
★ 58
Open GitHub ↗
Using a Dtrace with Python
Download README (.md)
Explore Similar Repositories
python-dtrace
:
A Python DTrace consumer using libdtrace - Now Python can be used as DTrace Provider and Consumer...
ruby-dtrace
:
Ruby bindings for DTrace
dtrocr
:
No description available.
cedi-dtrace
:
Provides a functional API for tracing programs across system and network boundaries.
DtronixPdf
:
PDF viewer and editor toolset.
// repository documentation
Was this content helpful?
★ 0
(0 ratings)
Select Rating:
★
★
★
★
★
Submit Feedback
Recent Feedback
×
Download README
Do you want to download the
README.md
file for
dtrace-py
?
Download (.md)
# Dtrace and Python This is a demonstration of using Dtrace with Python 3.6/3.7 suitable for a five minute lightning talk. You need an Apple Mac or another OS with Dtrace support. The demonstration shows how dtrace can attach and profile running Python processes giving you live profiling and debugging information. The fiction surrounding this demonstration is of a hot new startup that creates personalised cat videos and it wants to demonstrate its SRE skills by tracing a server in production, live! # Preparation Create a dtrace version of Python and a virtual environment in `~/venvs` directory (or wherever you prefer): ``` cd ~/tmp curl -o Python-3.7.0.tgz https://www.python.org/ftp/python/3.7.0/Python-3.7.0.tgz tar -xzf Python-3.7.0.tgz cd Python-3.7.0 ./configure --with-dtrace make python.exe -m venv ~/venvs/dtrace ``` If you want to show off Py-Spy then install it: ``` (dtrace36) paulross@Pauls-MBP-1 ~/dtrace-py (master) $ pip install py-spy Collecting py-spy Using cached https://files.pythonhosted.org/packages/67/77/57fbee60cb6870894a9436a80ba5e19bd46cc7d040615e5ab07863d1726a/py_spy-0.1.5-py2.py3-none-macosx_10_7_x86_64.whl Installing collected packages: py-spy Successfully installed py-spy-0.1.5 ``` ## Setup Create three shells, `cd` to the directory this README.md is in. In the first ('Python') shell, make it around 60 columns wide, activate dtrace Python3.6 and launch it, this will be used to run the python demo continuously: ``` . ~/venvs/dtrace/bin/activate python3 ``` In the second ('Dtrace') shell put it side by side with the 'Python' shell, if you can make it 100 columns wide that would be great. In a third ('Presentation') shell make it 85 columns wide with the text as large as possible for the presentation. ## Checks Check that the changes of `d_demo/a_py_flowinfo.d` from a previous demo in function-entry and function-return are absent, the line `/copyinstr(arg1) == "new_cat_video"/` should not be in the functions `python*:::function-entry` and `python*:::function-return`: Check that the version of Python you are running has probes, I'm assuming PID 24601 here: ``` $ sudo dtrace -l -P python24601 Password: ID PROVIDER MODULE FUNCTION NAME 4875 python24601 python3 _PyEval_EvalFrameDefault function-entry 4876 python24601 python3 _PyEval_EvalFrameDefault function-return 4877 python24601 python3 collect gc-done 4878 python24601 python3 collect gc-start 4879 python24601 python3 _PyEval_EvalFrameDefault line ``` # The Lightning Talk In the presentation shell run: ``` $ python3 presentation.py ``` The following keys work: * `<cr>` - Next slide. * `b<cr>` - Previous slide. * `q<cr>` - Quit * `r<cr>` - Refresh display (useful after resizing the command line). When you reach the "Live demo!" slide bring the other two shells to the foreground. In the dtrace shell bring up the `demo.py` code: 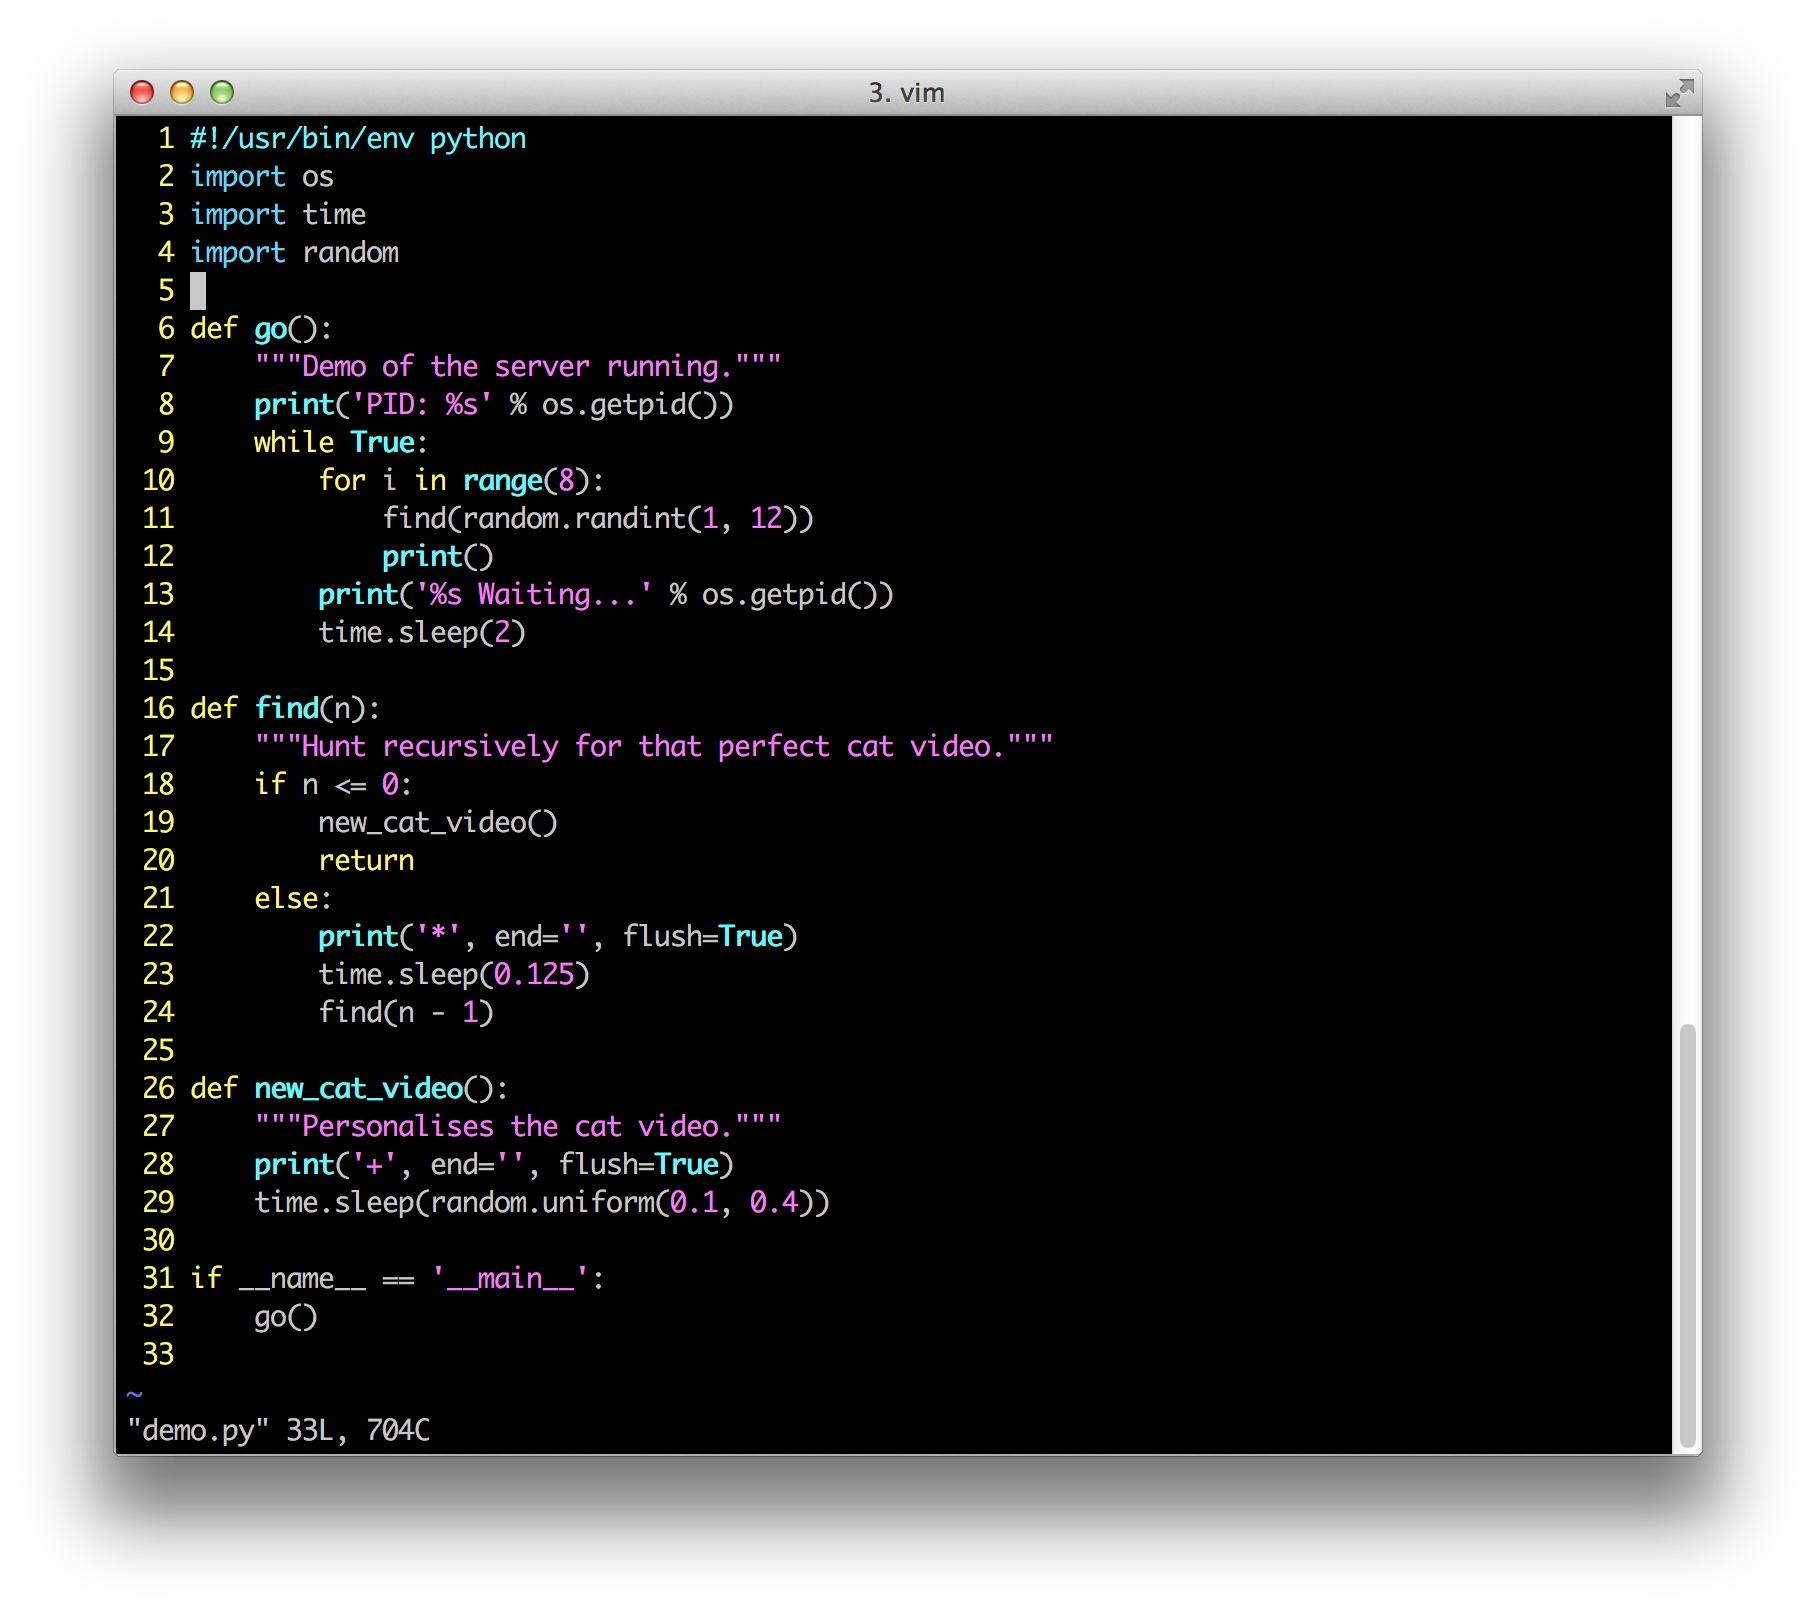 "This is a demo of a hot new startup that will deliver to you every day a personalised cat video. It examines your social media profile and searches the web for just the right cat video for you. Of course this is just a MVP for angel investors. In the code above, `go()` represents the server continuously running. It simulates serving 8 requests for cat videos by calling `find()` with a random number to represent the search depth. `find()` then calls `new_cat_video()` that randomly pauses to represent the hard work of personalising a cat video. Its really just a simulation of our server at work." In the Python shell launch Python, then start the server with: ``` >>> import demo >>> demo.go() ``` You should see something like this, the PID is important for the next step: 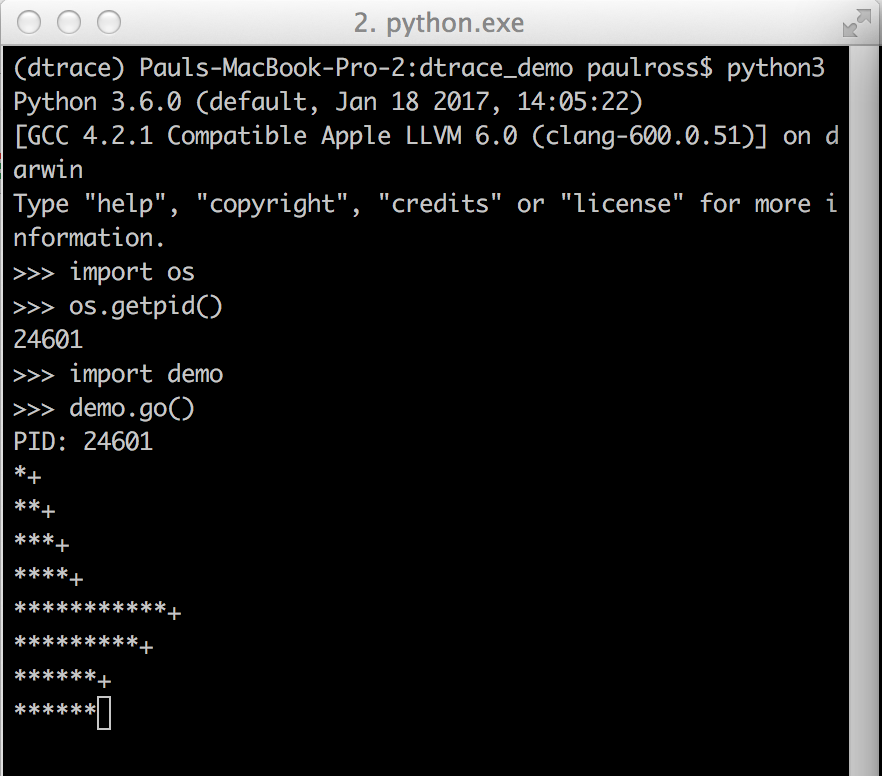 Each `*` represents part of the search and each `+` represents a cat video being personalised. "Now one of our SRE's want to trace what is going on in the production server." ## Tracing All Python Function Calls In the dtrace shell: ``` $ sudo dtrace -s d_demo/a_py_flowinfo.d -p 24601 ``` You should see something like this [`Ctrl-C` to stop tracing]: 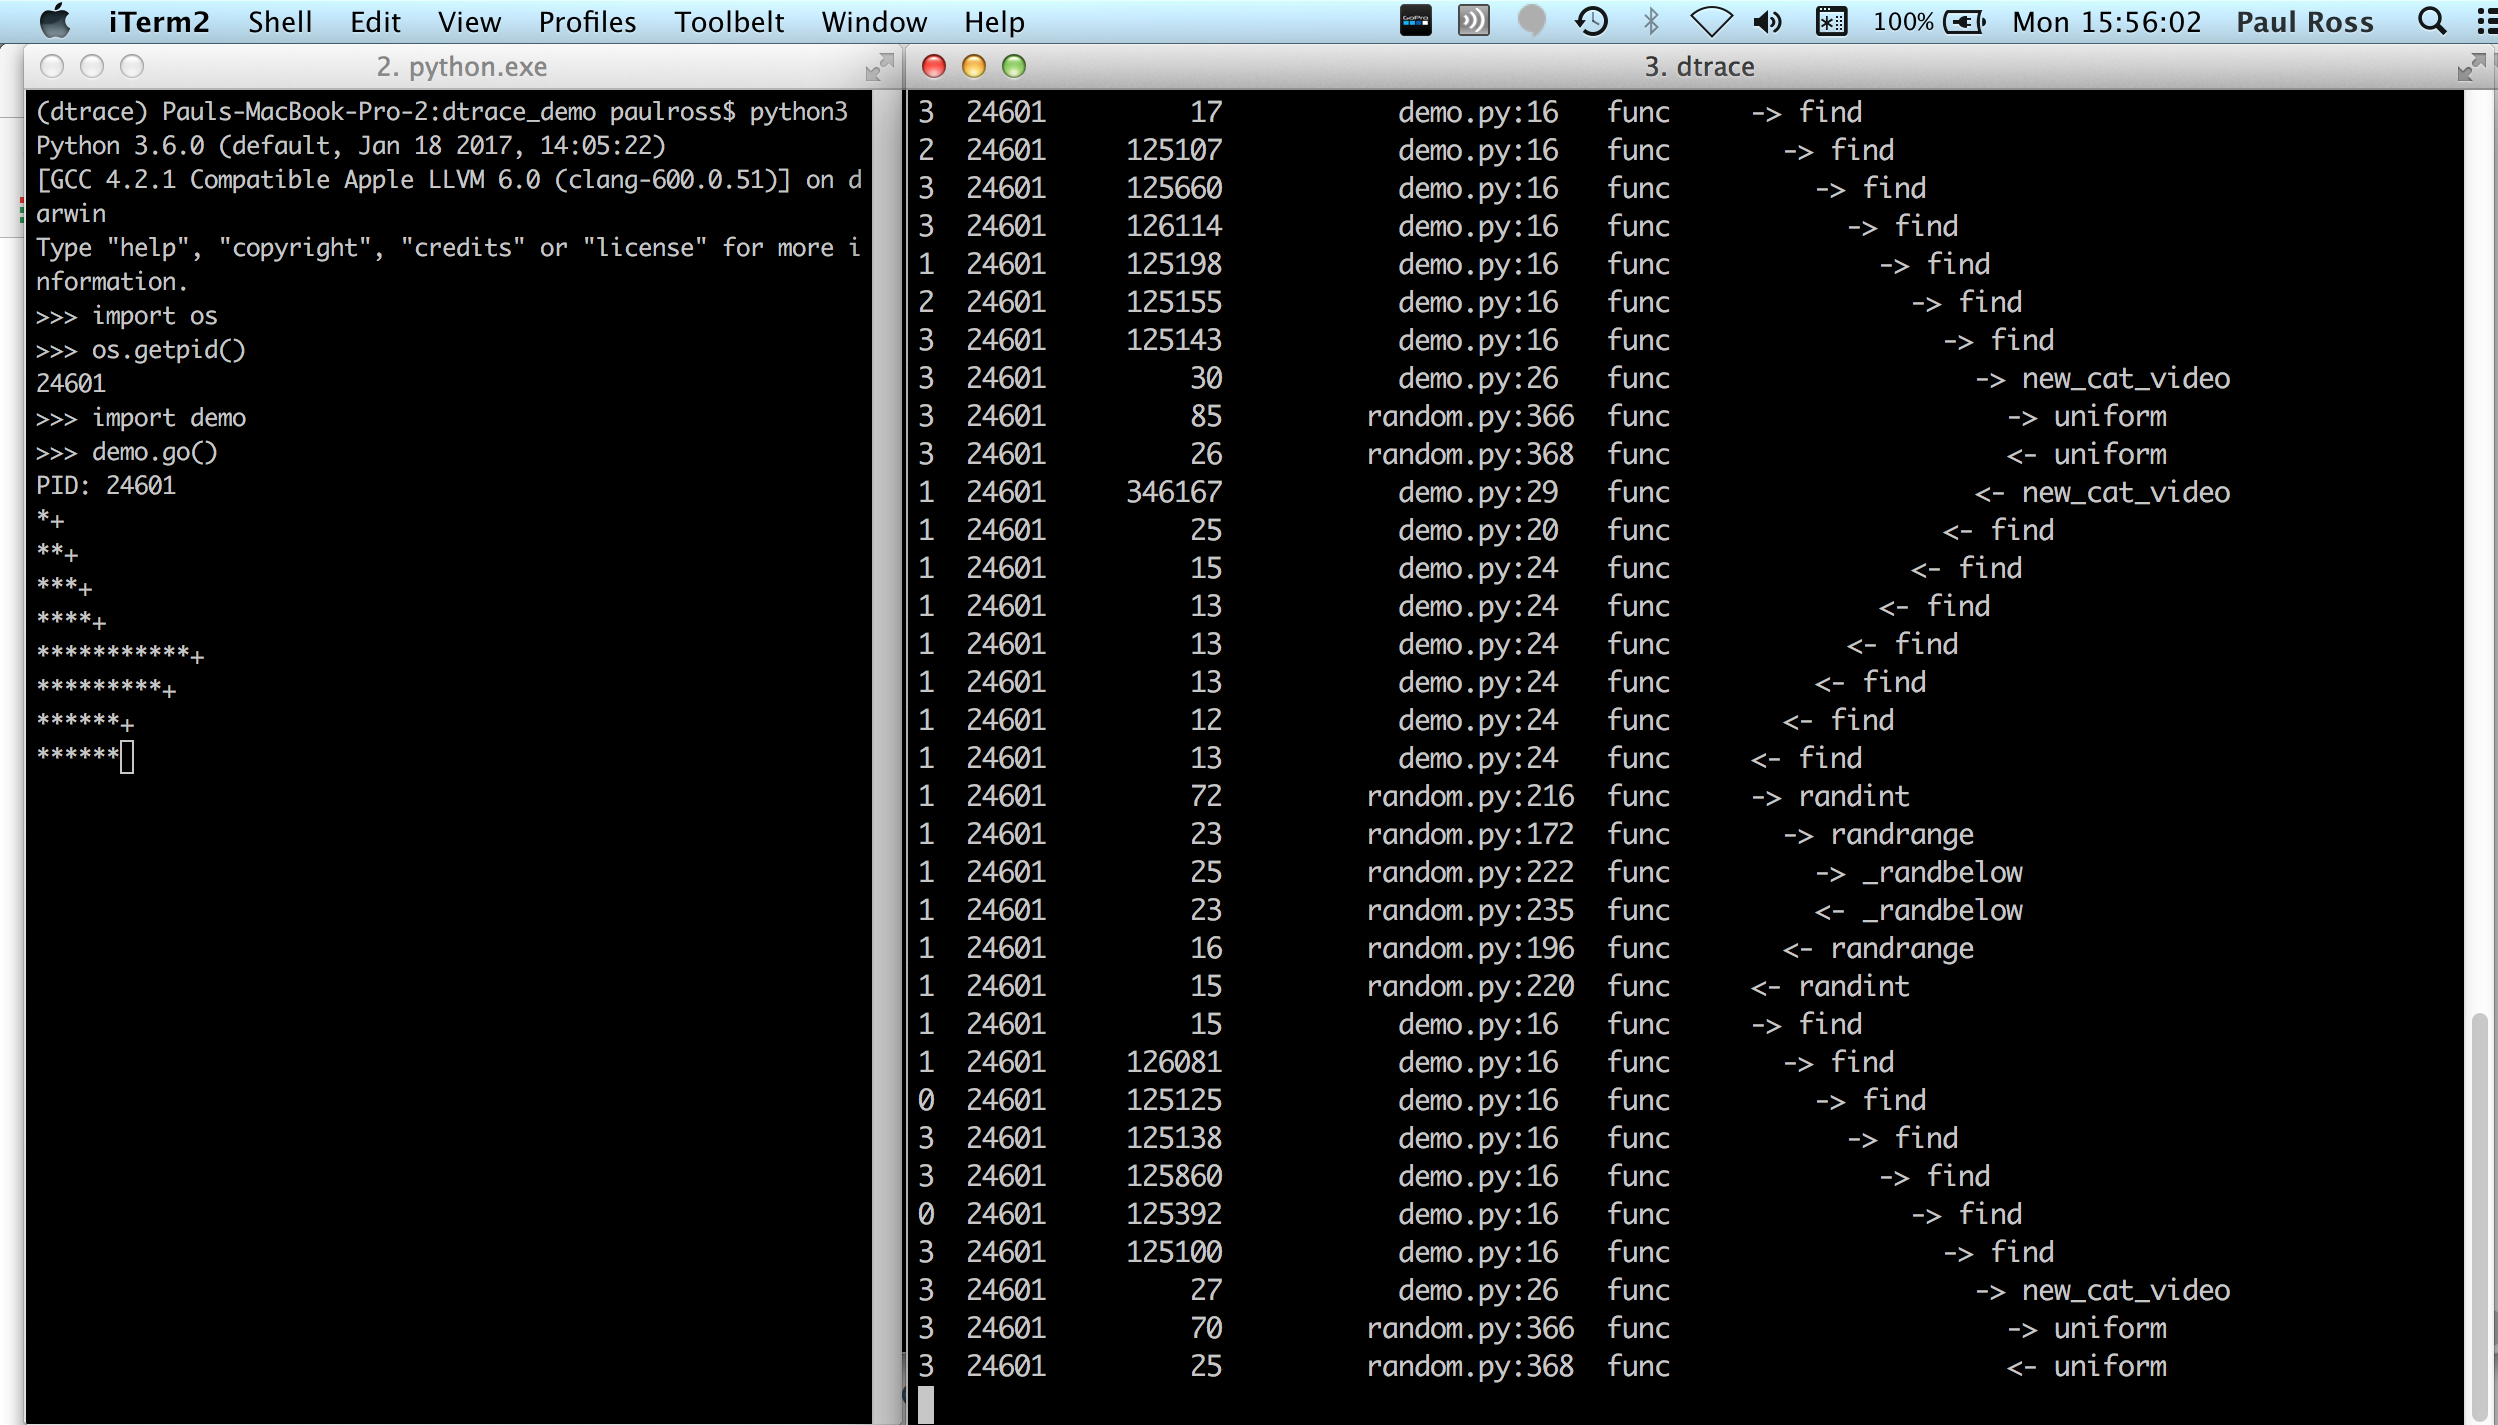 On the right we have the following columns for each function call or return: 1. Core number. 2. PID. 3. Delta time in microseconds from previous line. 4. Source file and line number. 5. Type of the probe, in all these cases it is func but garbage collection start/stop is also possible. 6. Function, indented by stack depth. This even traces the standard library of course. "I don't want the whole call stack, its too much, just give me the `new_cat_video()` function call." ## Tracing a Specific Function You can edit `d_demo/a_py_flowinfo.d` to show only the function `new_cat_video()` by copying line 53 which is the predicate: `/copyinstr(arg1) == "new_cat_video"/` ``` $ vi d_demo/a_py_flowinfo.d ``` And inserting this predicate as lines 75 and 86: 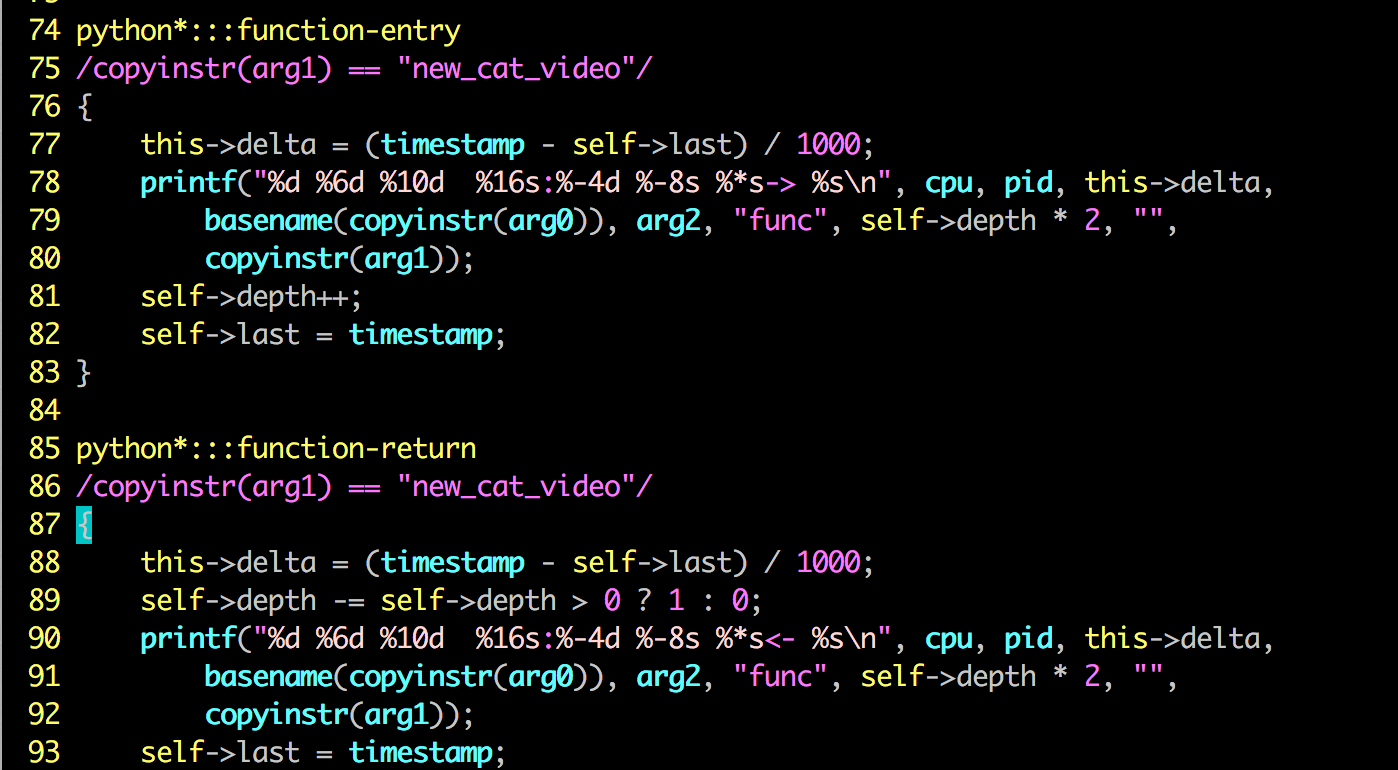 Running the same command: ``` $ sudo dtrace -s d_demo/a_py_flowinfo.d -p 24601 ``` You should see something like this: 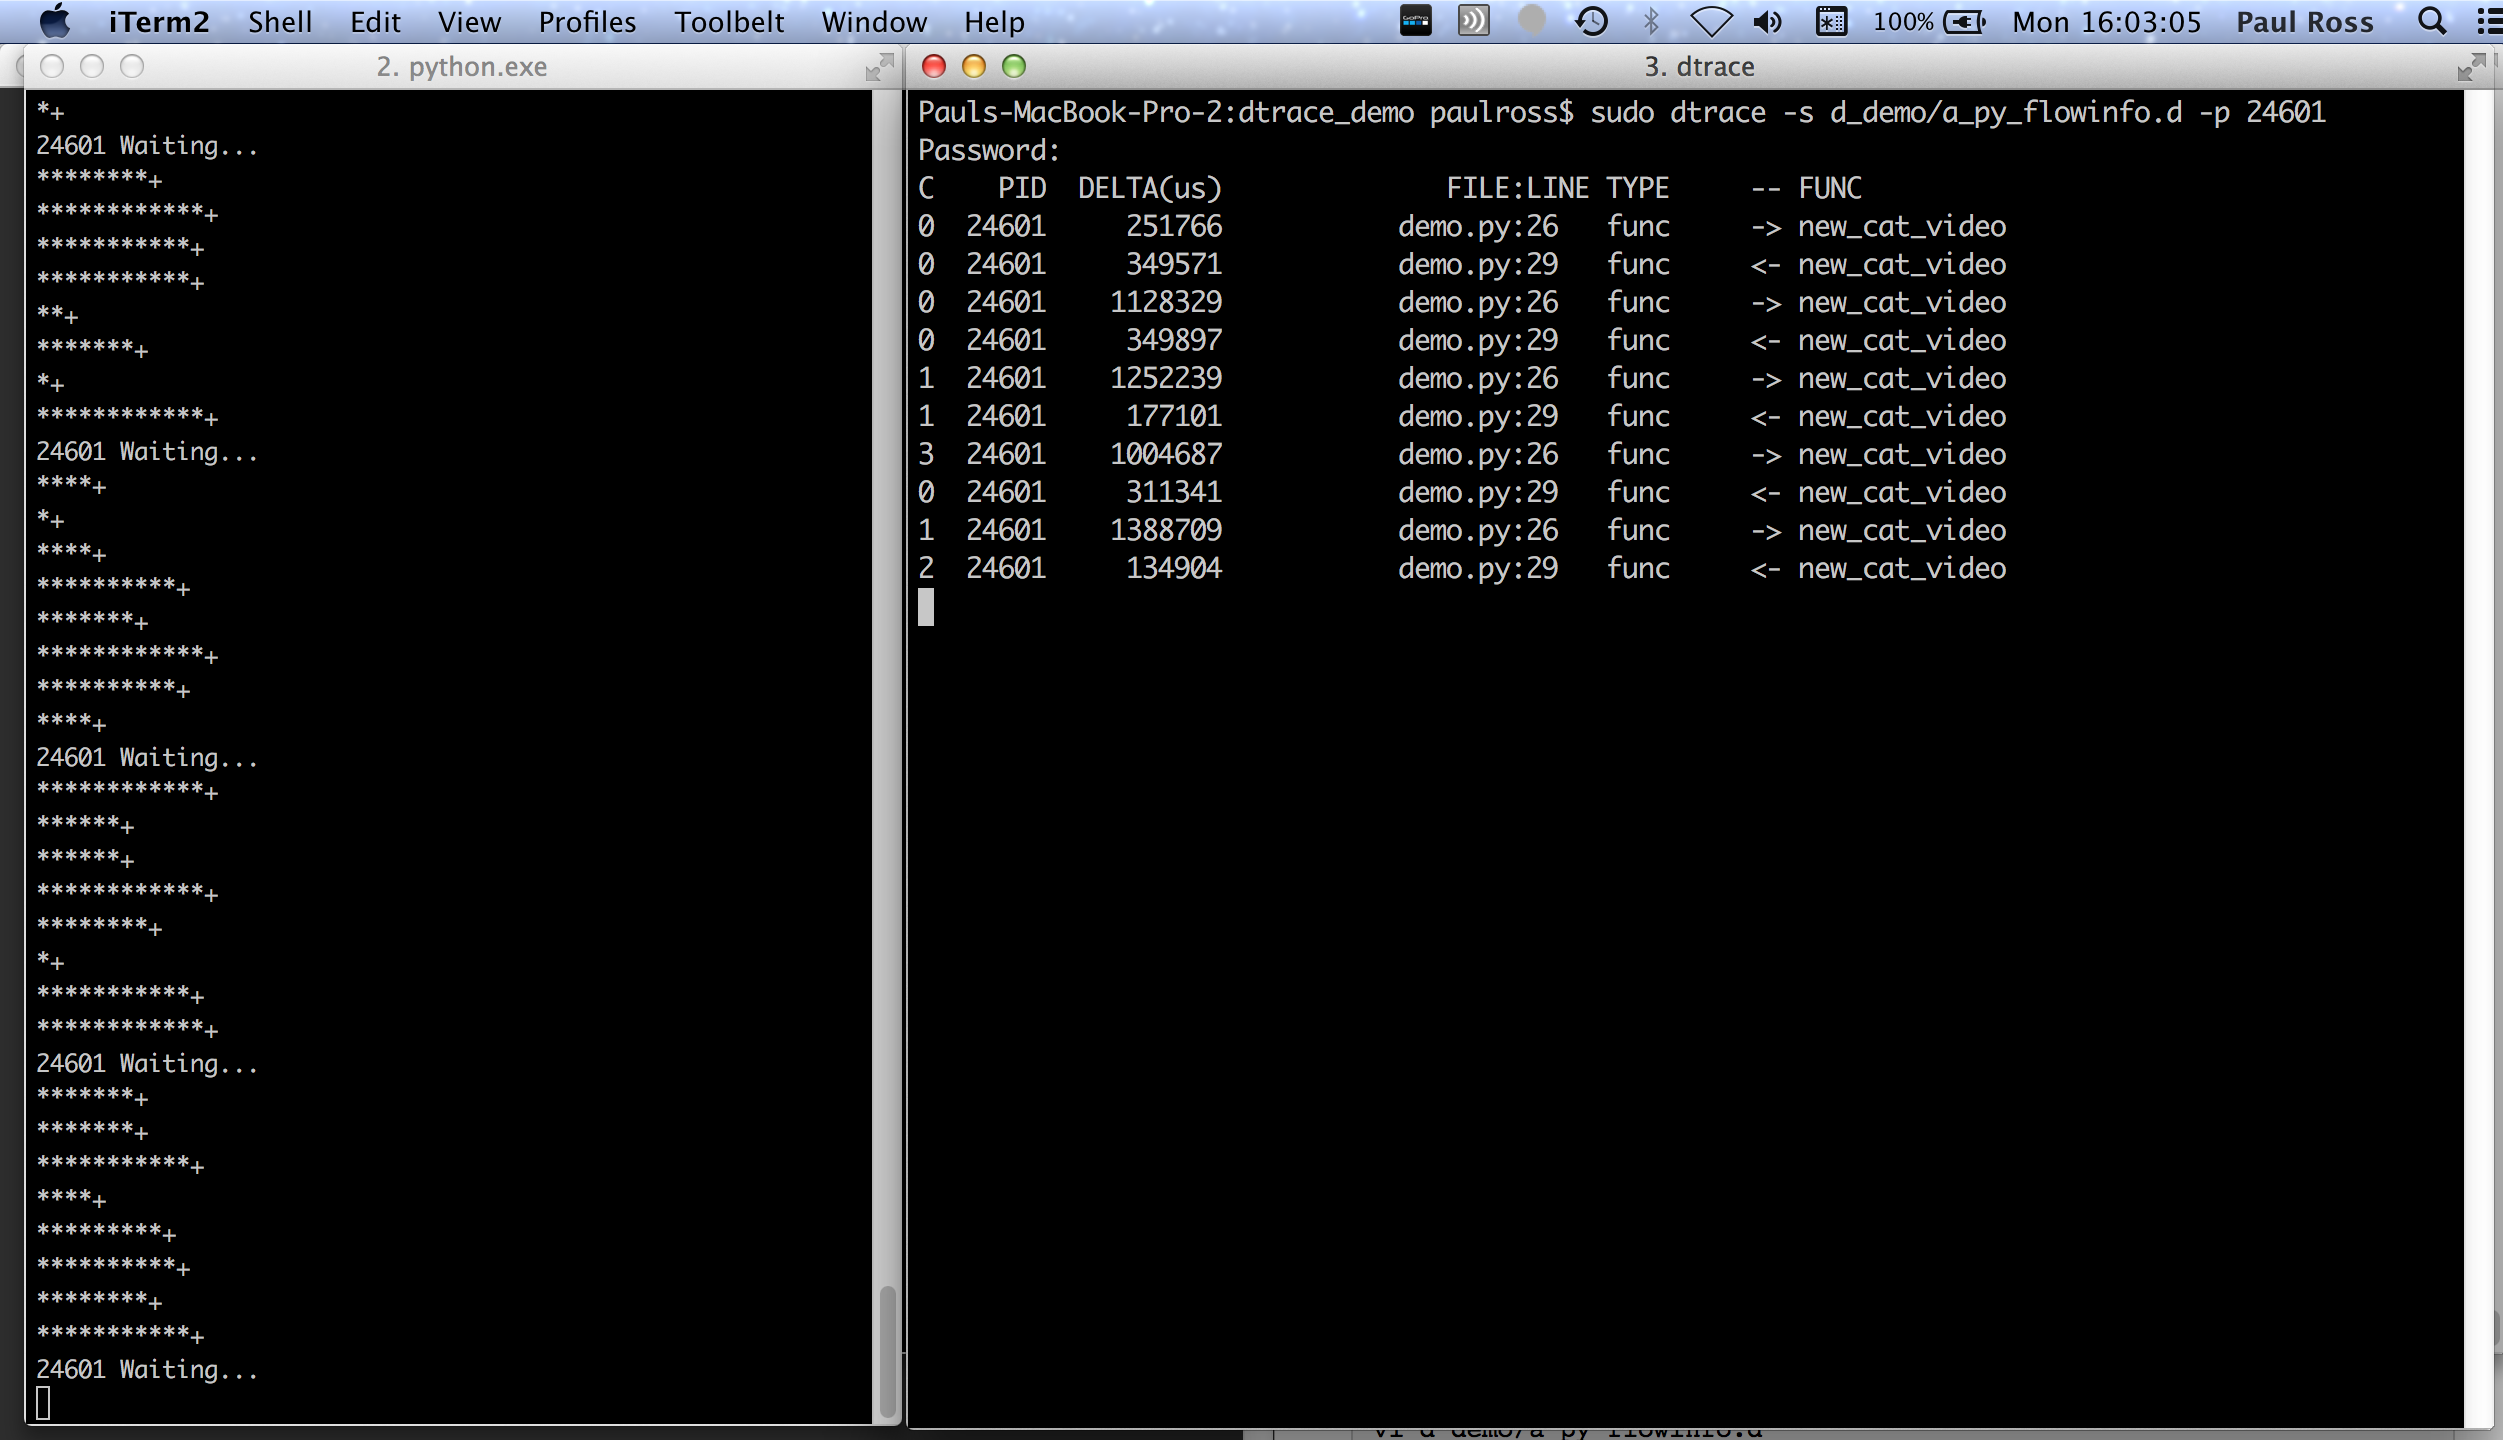 ## Function Counting This aggregates the the function calls and the execution time. Use the command: ``` $ sudo dtrace -s d_demo/b_py_calltime.d -p 24601 ``` Wait for a few seconds then hit `Ctrl-C` and you will see: 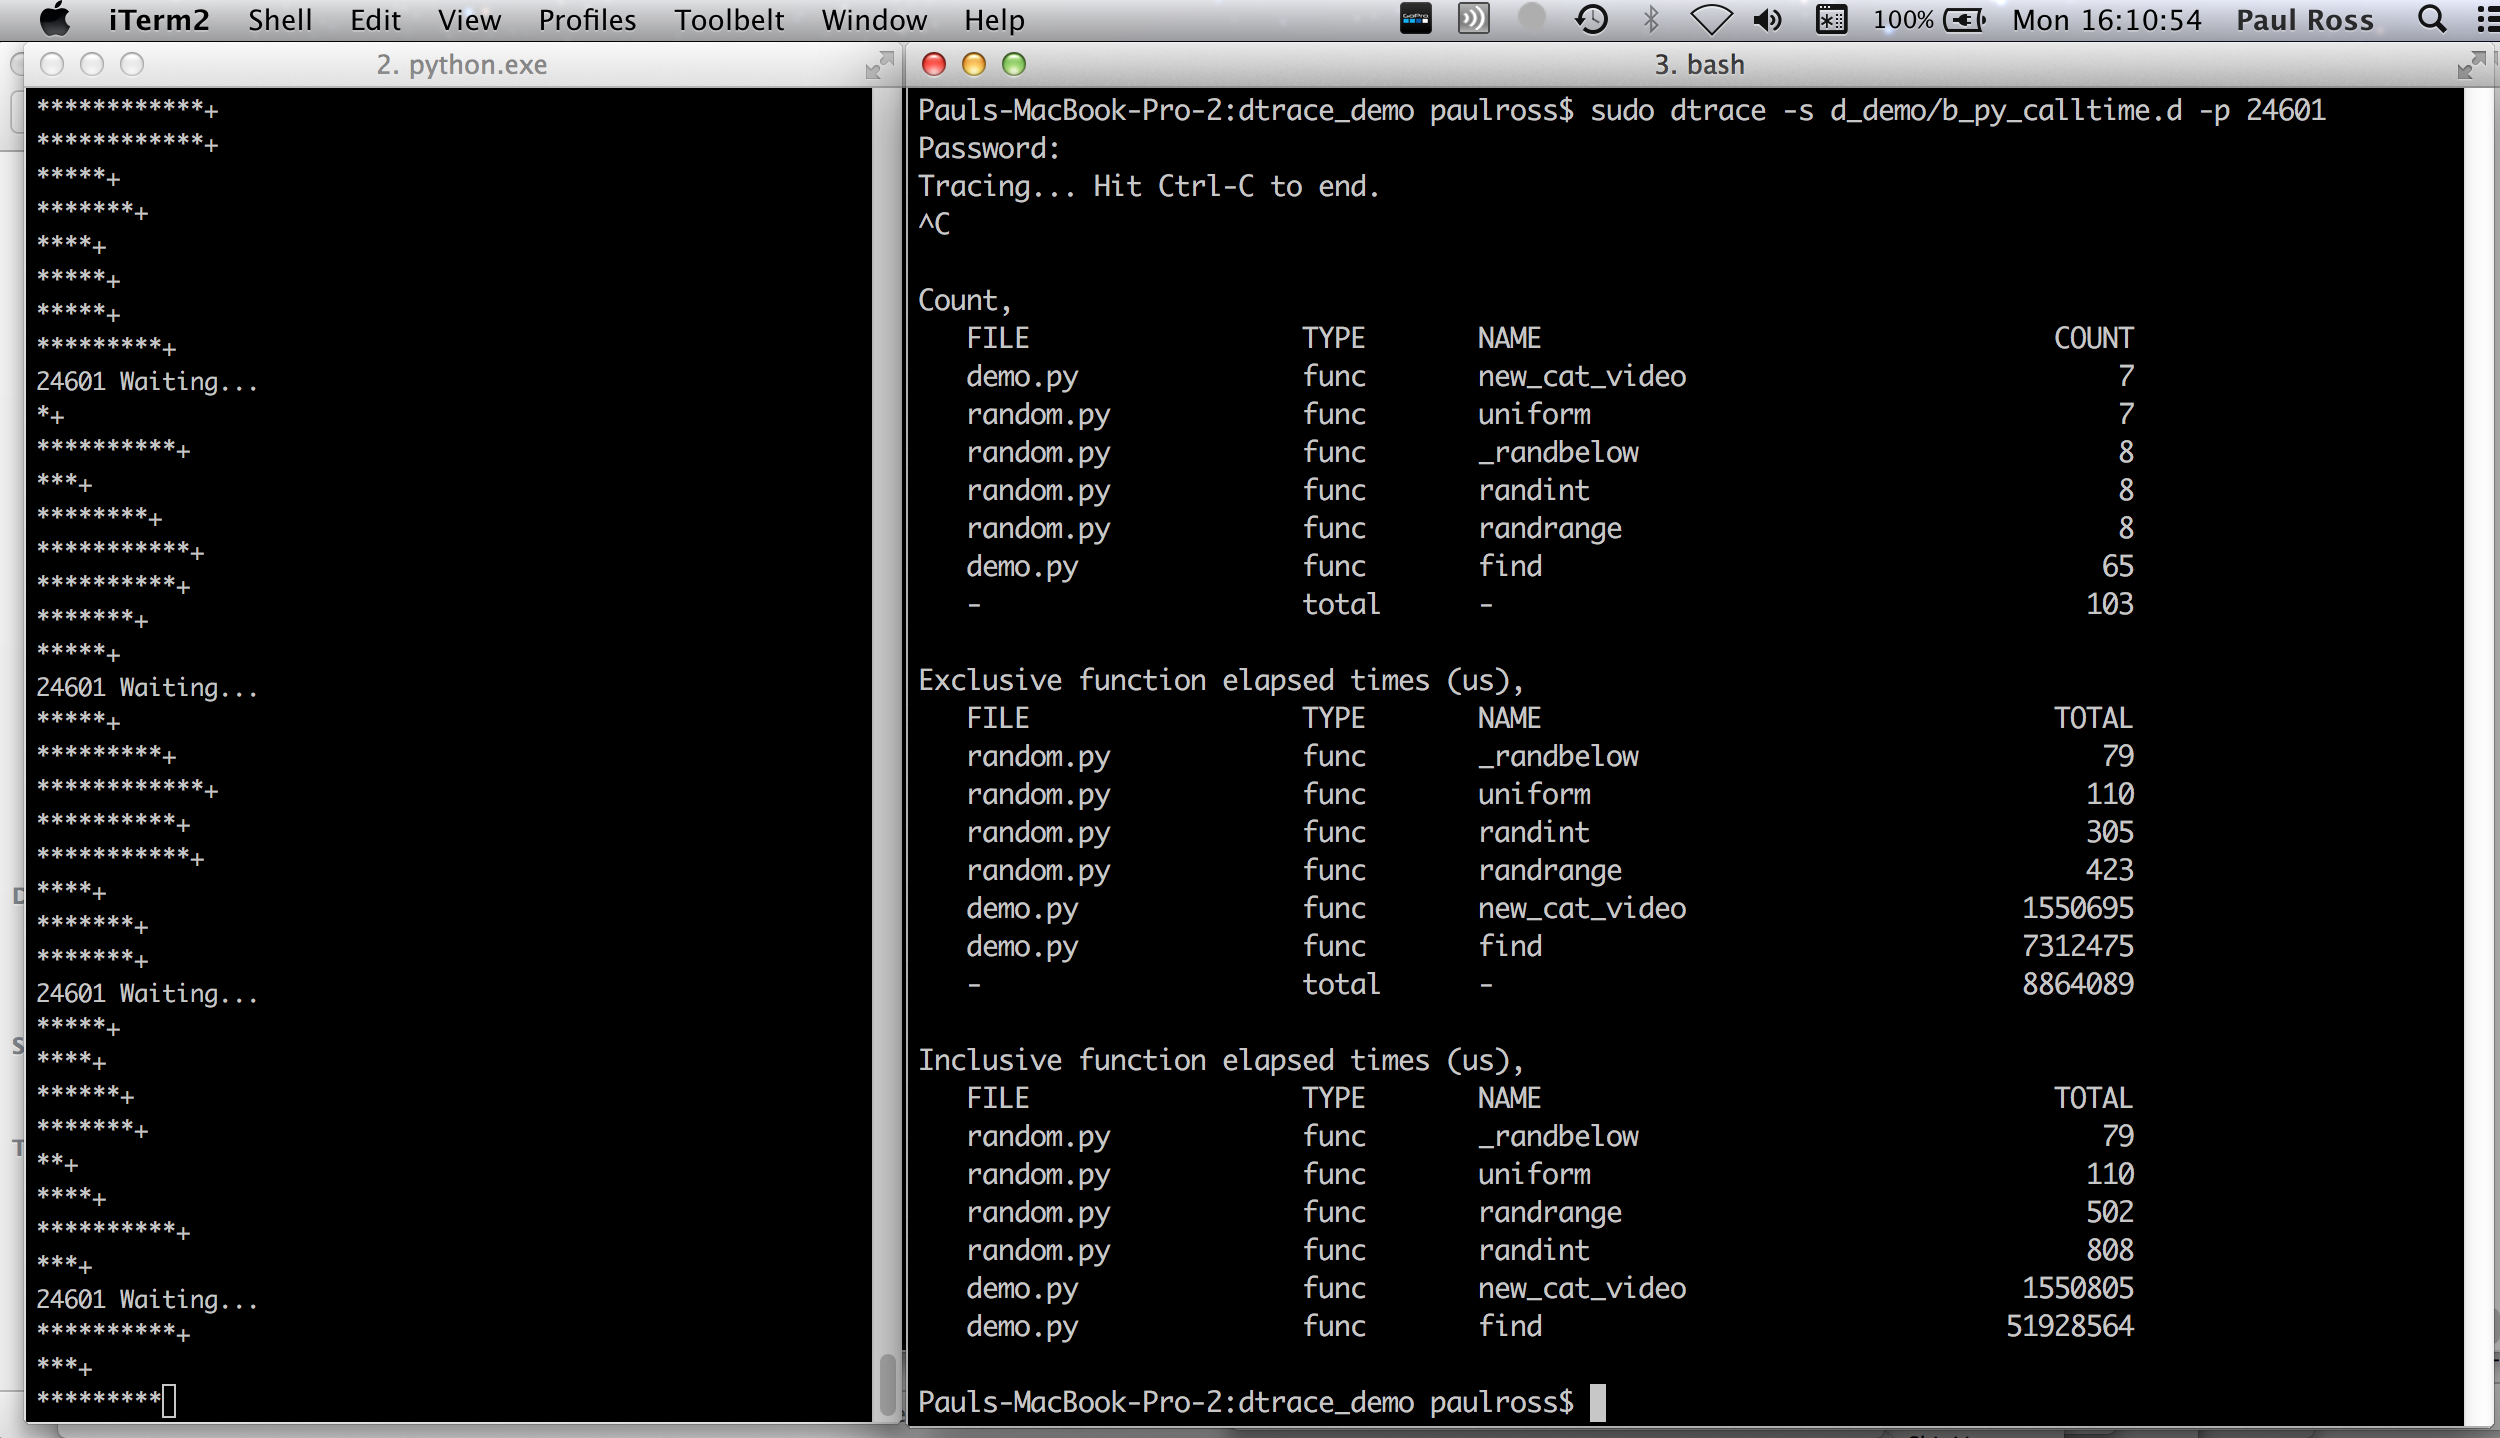 This gives the count of function calls and the inclusive and exclusive time spent in them in microseconds. "But all those numbers, can't we have pictures?" ## Function Execution Time Histogram With the command: ``` $ sudo dtrace -s d_demo/c_py_calldist.d -p 24601 ``` You should see an ASCII histogram, note `demo.py, func, new_cat_video`, the second table from the bottom: 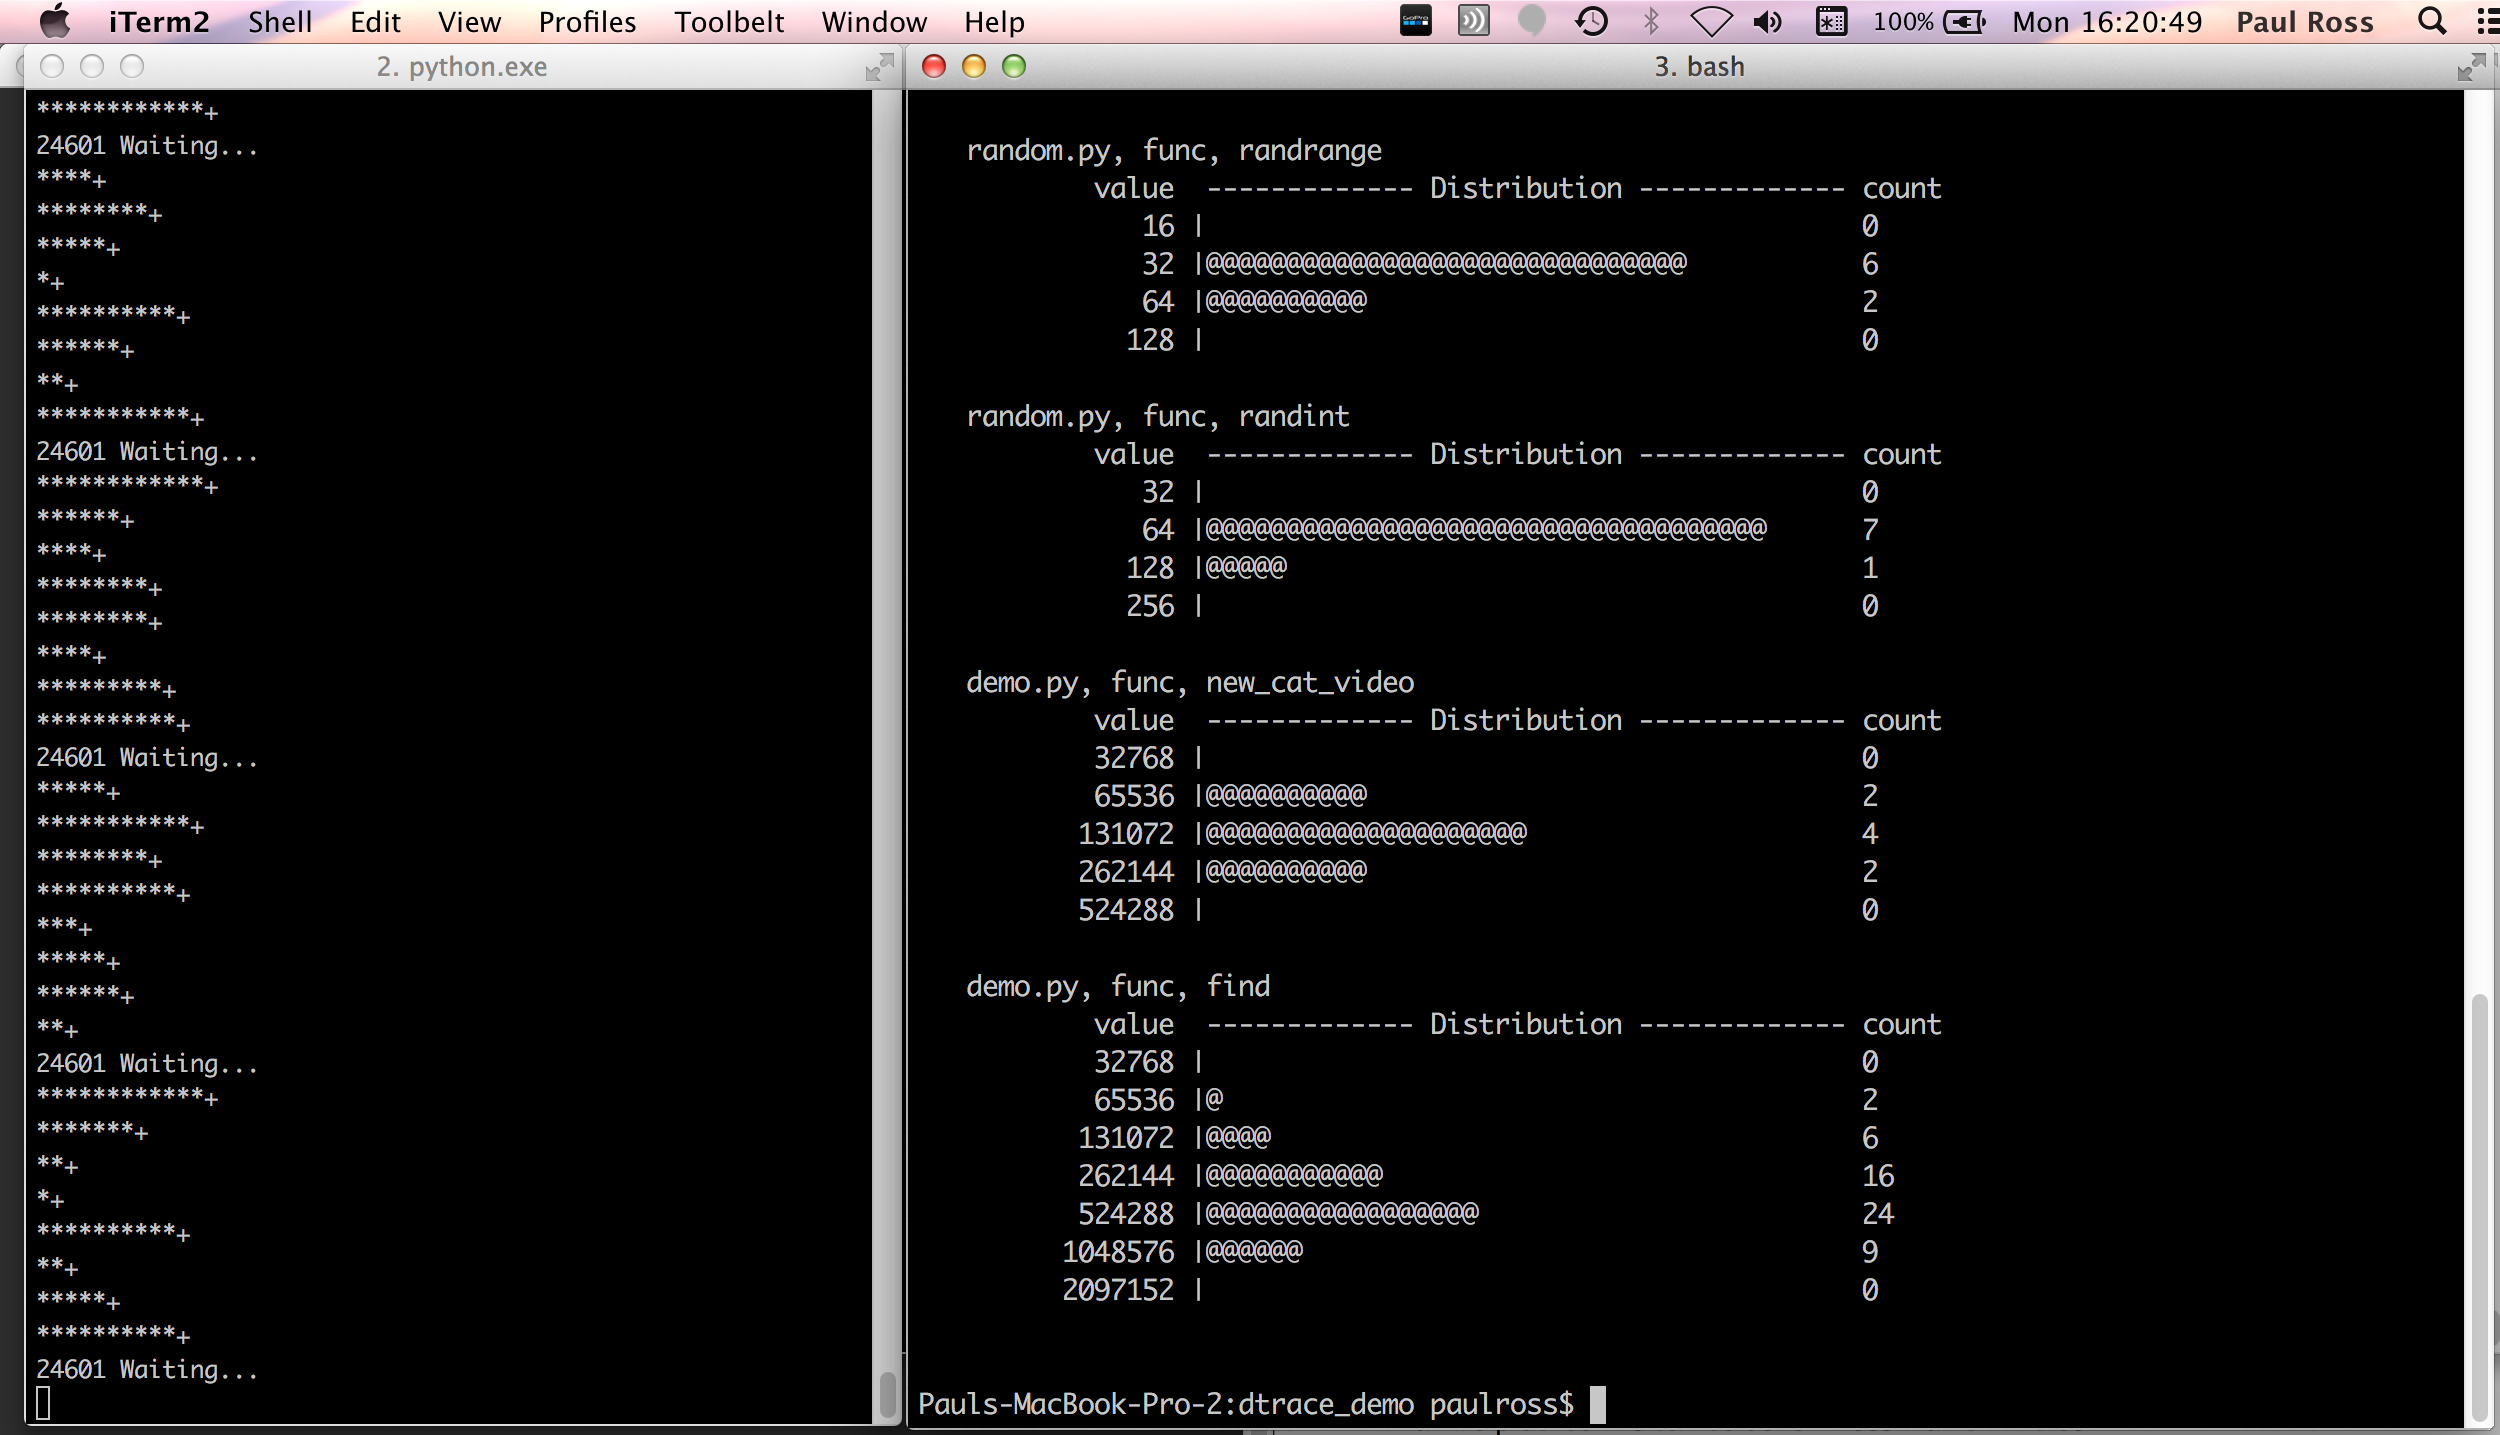 That is the demo over, now back to the presentation shell and finish that off. With a little practice this can all be done in less than 5 minutes. # Py-Spy If you are quick you might be able to demonstrate Py-Spy. [Py-Spy](https://github.com/benfred/py-spy) is a sampling profiler for Python programs. It lets you visualize what your Python program is spending time on without restarting the program or modifying the code in any way. Py-Spy is extremely low overhead: it is written in Rust for speed and doesn't run in the same process as the profiled Python program, nor does it interrupt the running program in any way. This means Py-Spy is safe to use against production Python code. Py-Spy works on Linux, OSX and Windows, and supports profiling all recent versions of the CPython interpreter (versions 2.3-2.7 and 3.3-3.6). Here is Py-Spy sampling our which is running this time as PID 6871: ``` $ sudo py-spy -p 6871 ``` 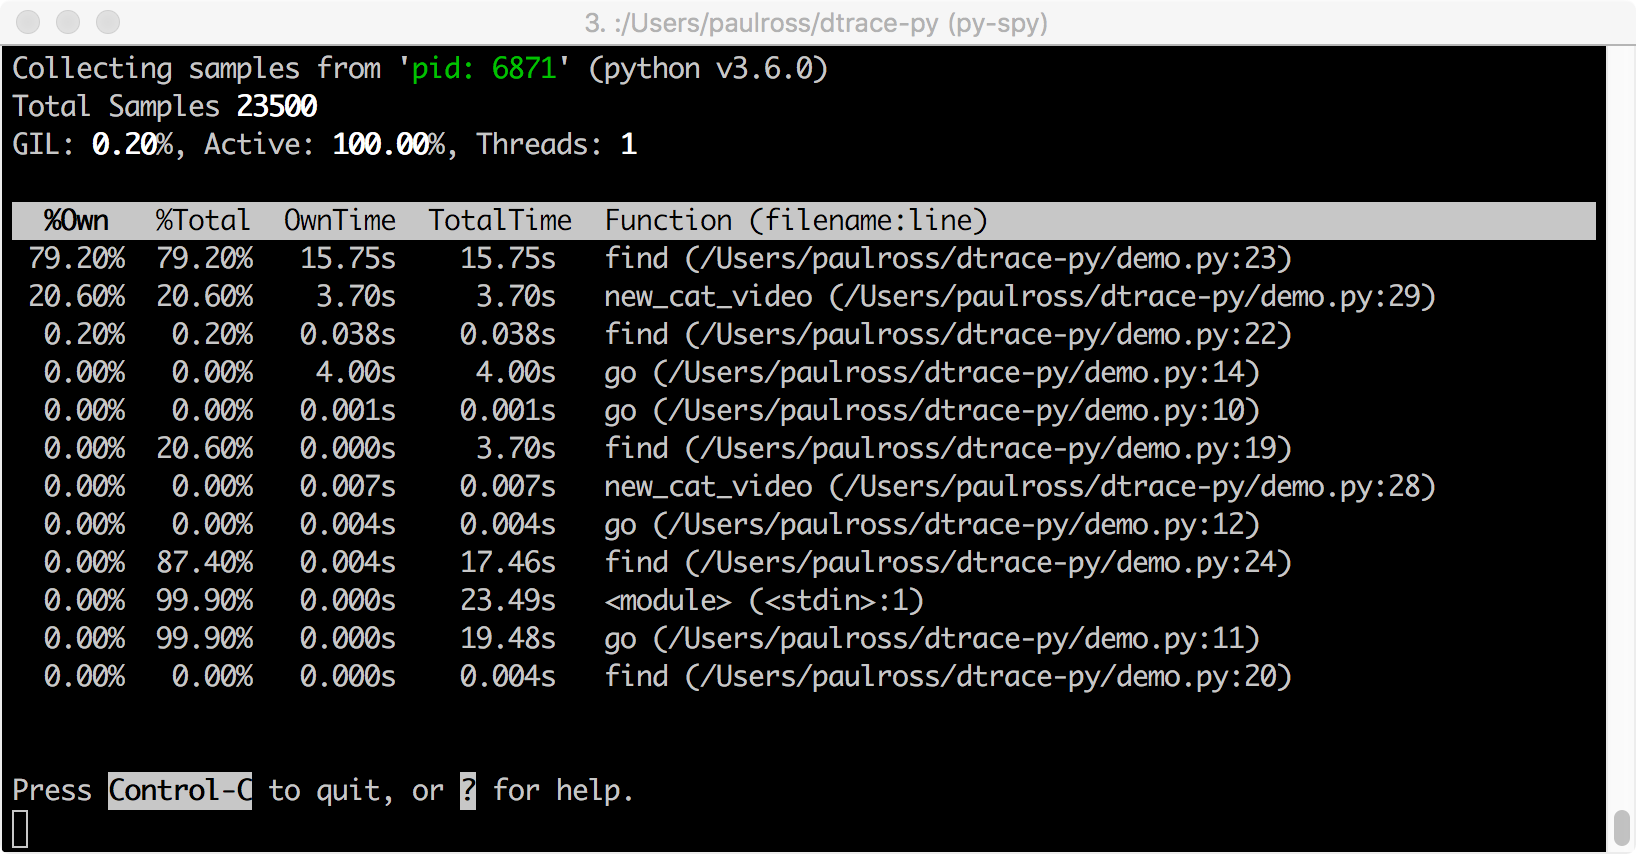 And the interactive SVG flame graph obtained by: ``` $ sudo py-spy -p 6871 -f images/PySpyFlame.svg ``` 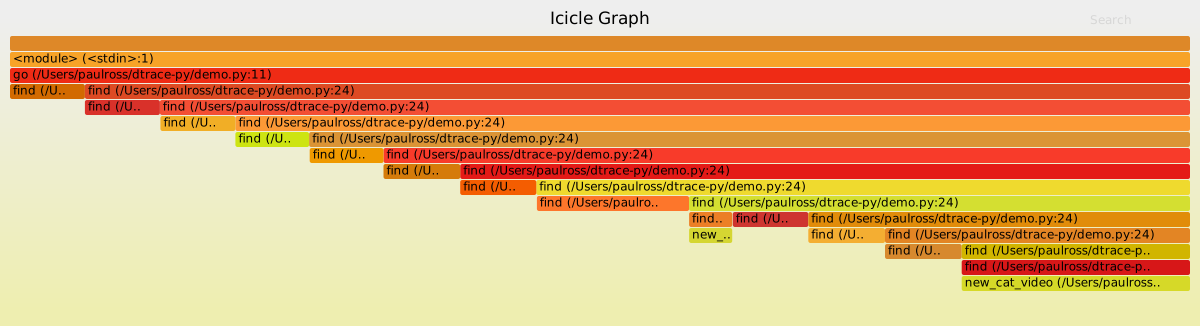 # Further Resources * Dtrace on [Wikipedia](http://en.wikipedia.org/wiki/DTrace) * The Dtrace [website](http://dtrace.org/blogs/). * Brendan Gregg on [Dtrace](http://www.brendangregg.com/dtrace.html) and the [Dtrace toolkit](http://www.brendangregg.com/dtracetoolkit.html). * Brendan on [eBPF](http://www.brendangregg.com/ebpf.html), the Linux equivalent ot Dtrace. * Py-Spy [home page](https://github.com/benfred/py-spy) In this repo you will find a other Dtrace `*.d` files for Python in the `toolkit/` directory.
