KO
|
EN
gitlite — search
Search
#javascript
#python
#hacktoberfest
#react
#ai
#typescript
#llm
#go
#golang
#android
#machine-learning
#rust
#deep-learning
#linux
cpm-python
★ 24
Open GitHub ↗
No description available.
Download README (.md)
Explore Similar Repositories
web-starter-parcel
:
Web starter using Parcel for "Learn JavaScript"
gifex
:
Powerful yet simple Desktop GIF recorder.
isus-app
:
O super app do Profissional de Saúde, responde à demanda de relacionamento entre usuários, trabalhadores e gestores do SUS.
korean-pytorch-sentiment-analysis
:
PyTorch와 TorchText를 이용한 한국어 감정 분석 연습
Roleplay-Website-EN
:
Roleplay Website English
// repository documentation
Was this content helpful?
★ 0
(0 ratings)
Select Rating:
★
★
★
★
★
Submit Feedback
Recent Feedback
×
Download README
Do you want to download the
README.md
file for
cpm-python
?
Download (.md)
# Critical Path Method ## The critical path method, or critical path analysis, is an algorithm for scheduling a set of project activities. It is commonly used in conjunction with the program evaluation and review technique. This is a python program that - takes an activity table with each activity's predecessors and duration and stores it into a graph - using a modified Breadth First Search algorithm to traverse the graph and determine the correct path - calculates number of attributes for each activity following the selected path, these attributes are : - DU = Activity Duration - ES = Early Start Time - EF = Early Finish Time - LS = Late Start Time - LF = Late Finish Time - SK = Slack Value - draws a plot showing the the graph, attributes for each node and critical path (green nodes), --- ## Here is Some Sample Tests And It's Output | Activity | Predecessors | Duration | | -------- | ------------ | -------- | | A | - | 7 | | B | A | 9 | | C | A | 3 | | D | B | 8 | | E | C | 5 | | F | C | 4 | | G | D E F | 2 | | H | G | 1 | ## 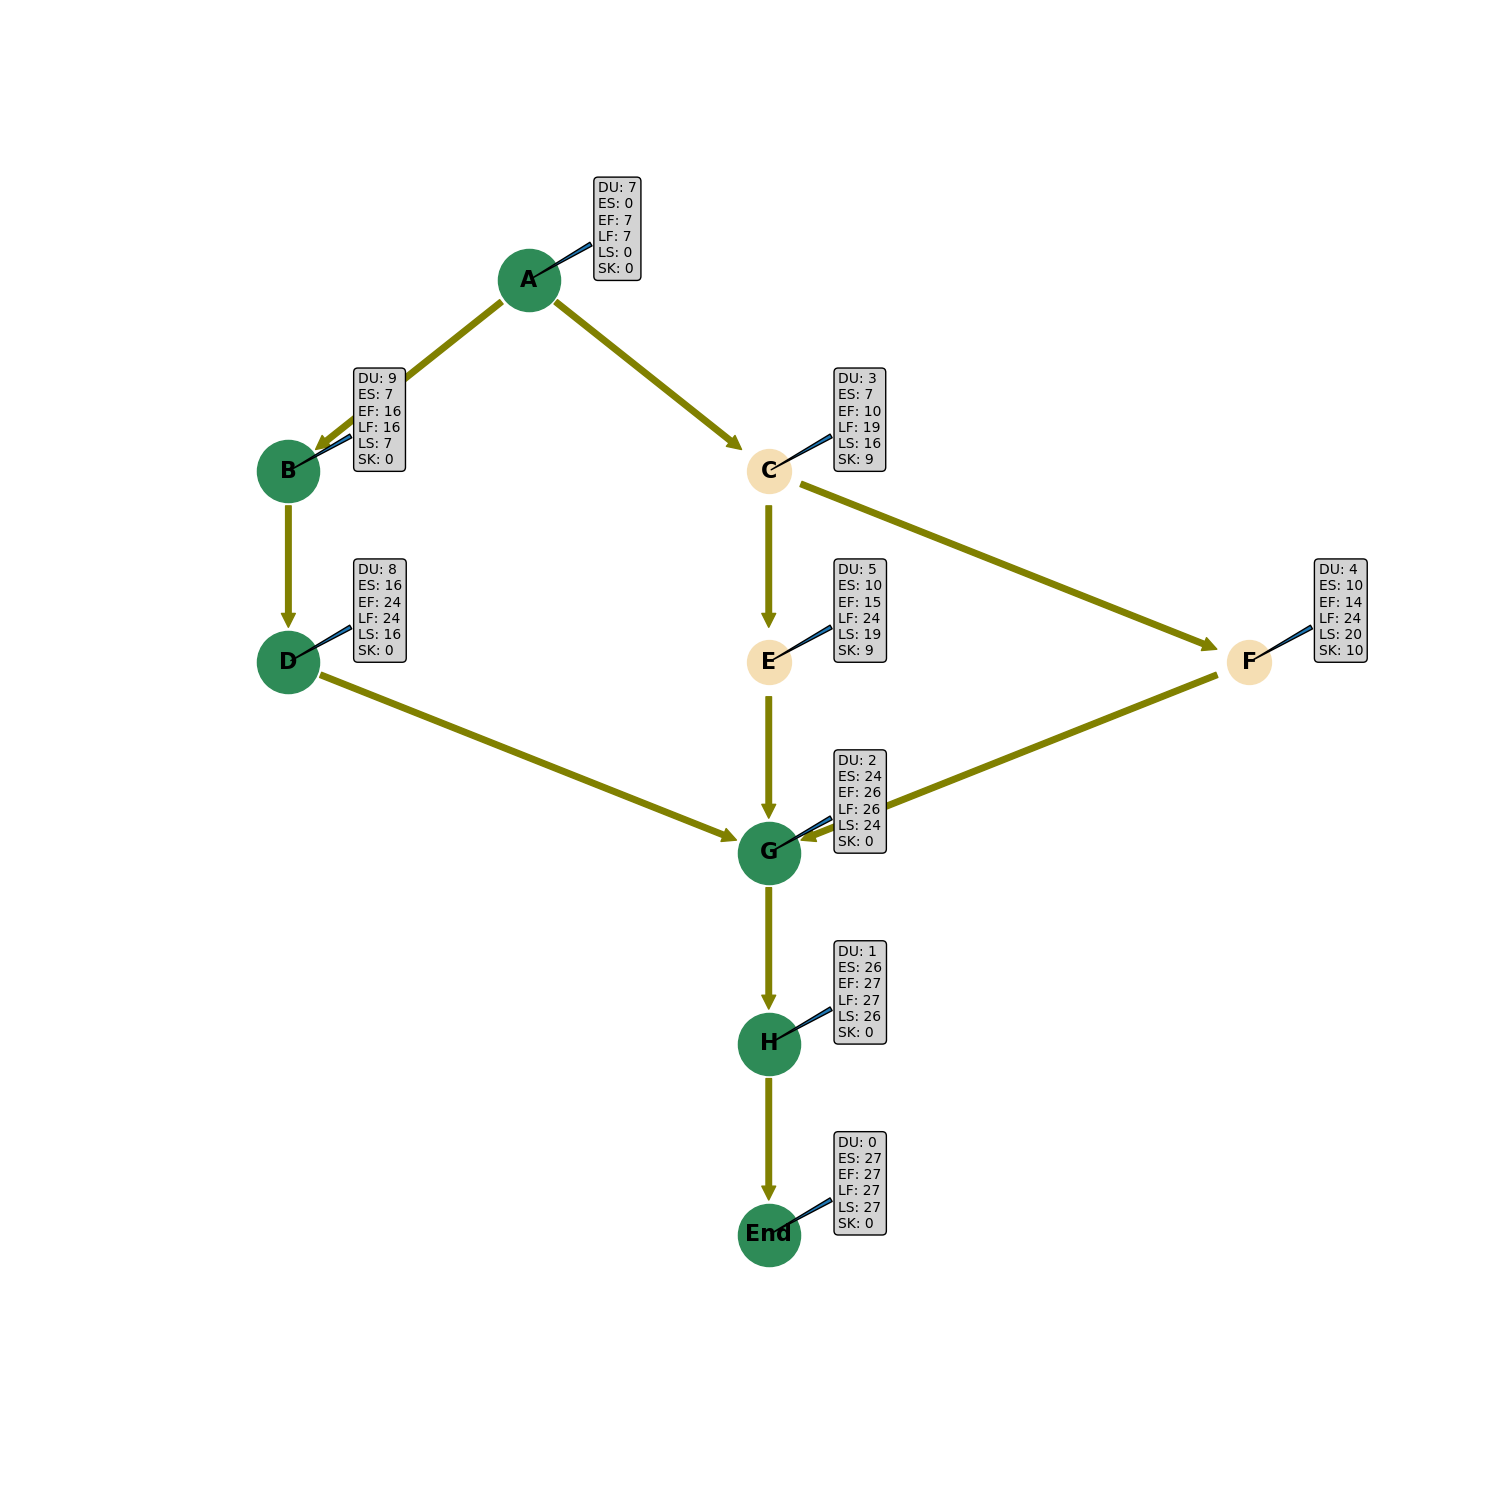 | Activity | Predecessors | Duration | | -------- | ------------ | -------- | | A | - | 5 | | B | - | 4 | | C | A | 7 | | D | A | 3 | | E | B | 2 | | F | D | 9 | | G | B C | 8 | ## 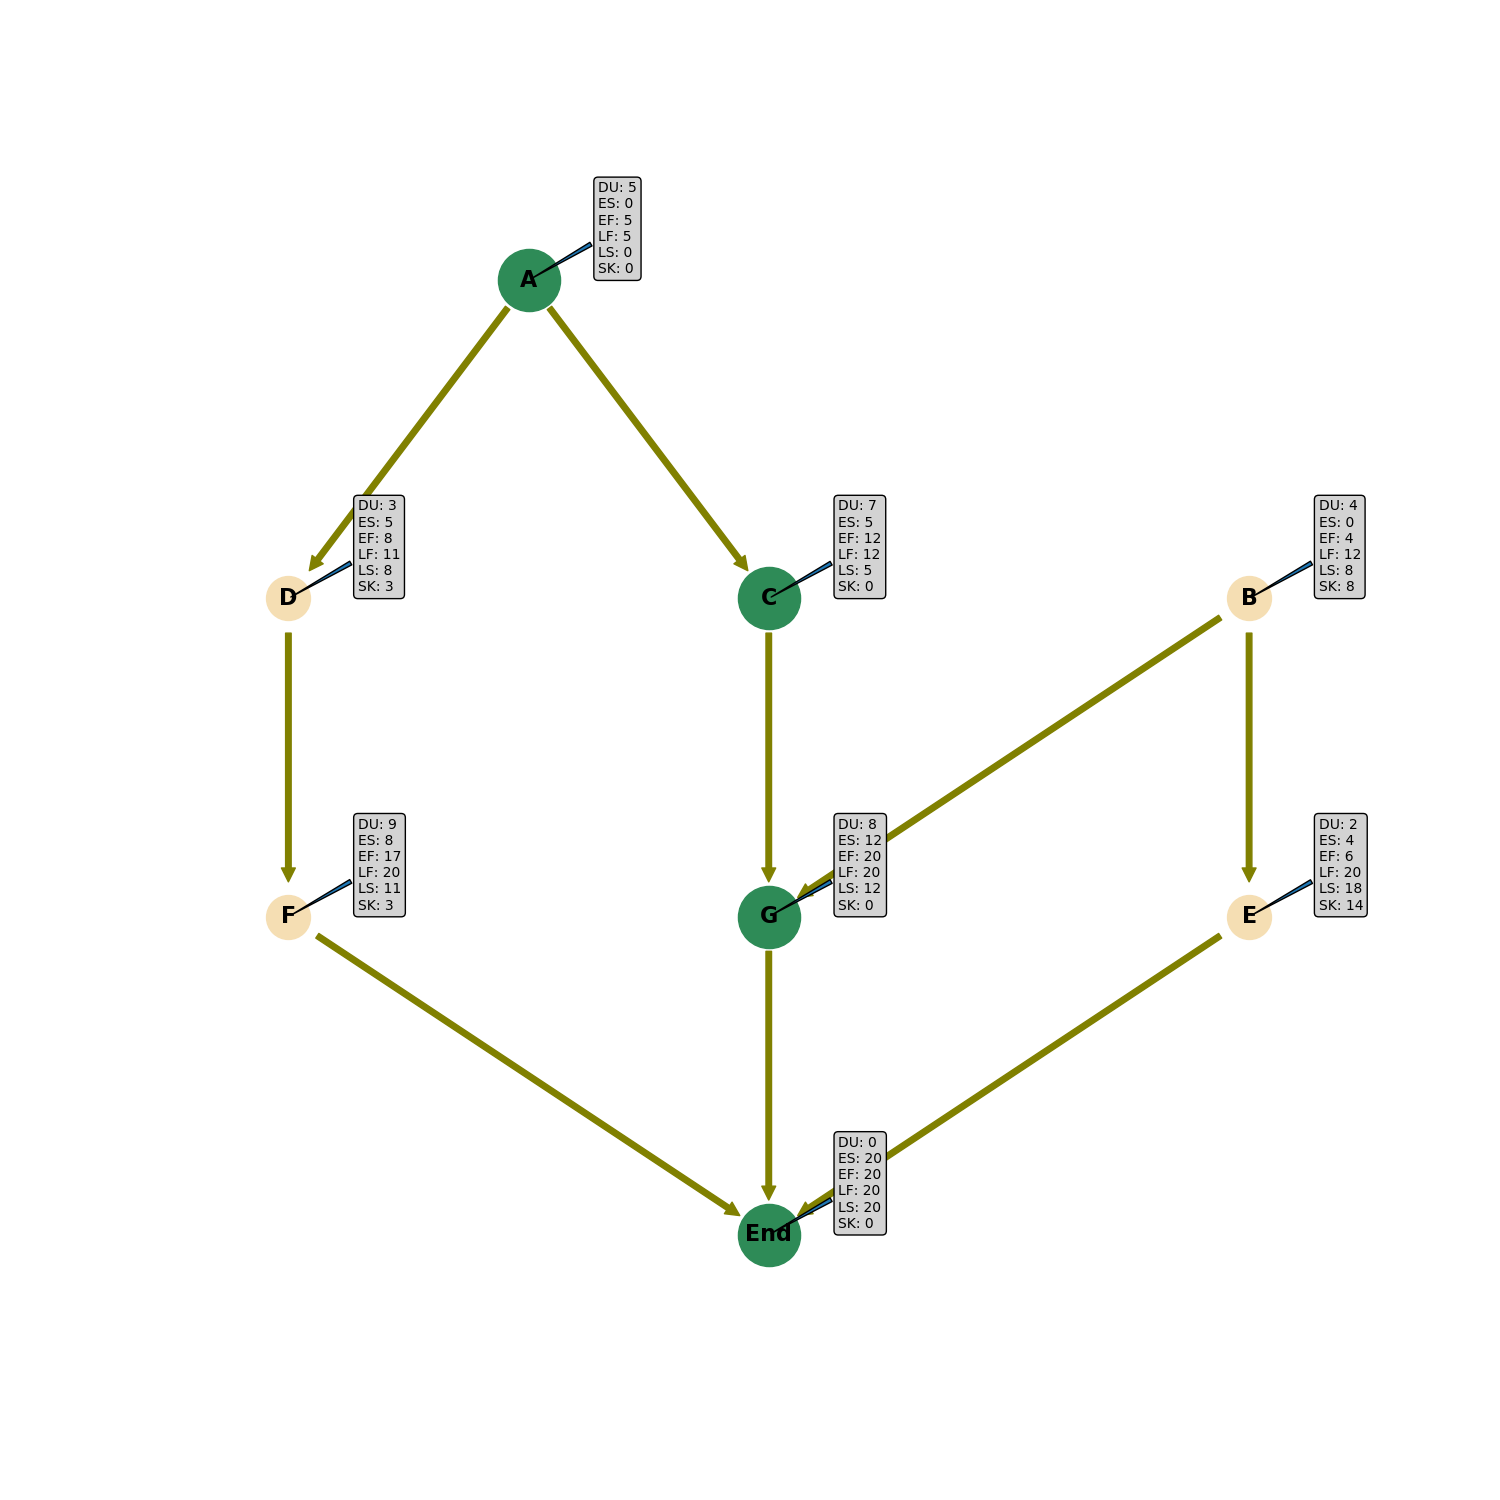 | Activity | Predecessors | Duration | | -------- | ------------ | -------- | | A | - | 3 | | B | A | 4 | | C | A | 2 | | D | B | 5 | | E | C | 1 | | F | C | 2 | | G | D E | 4 | | H | F G | 3 | ## 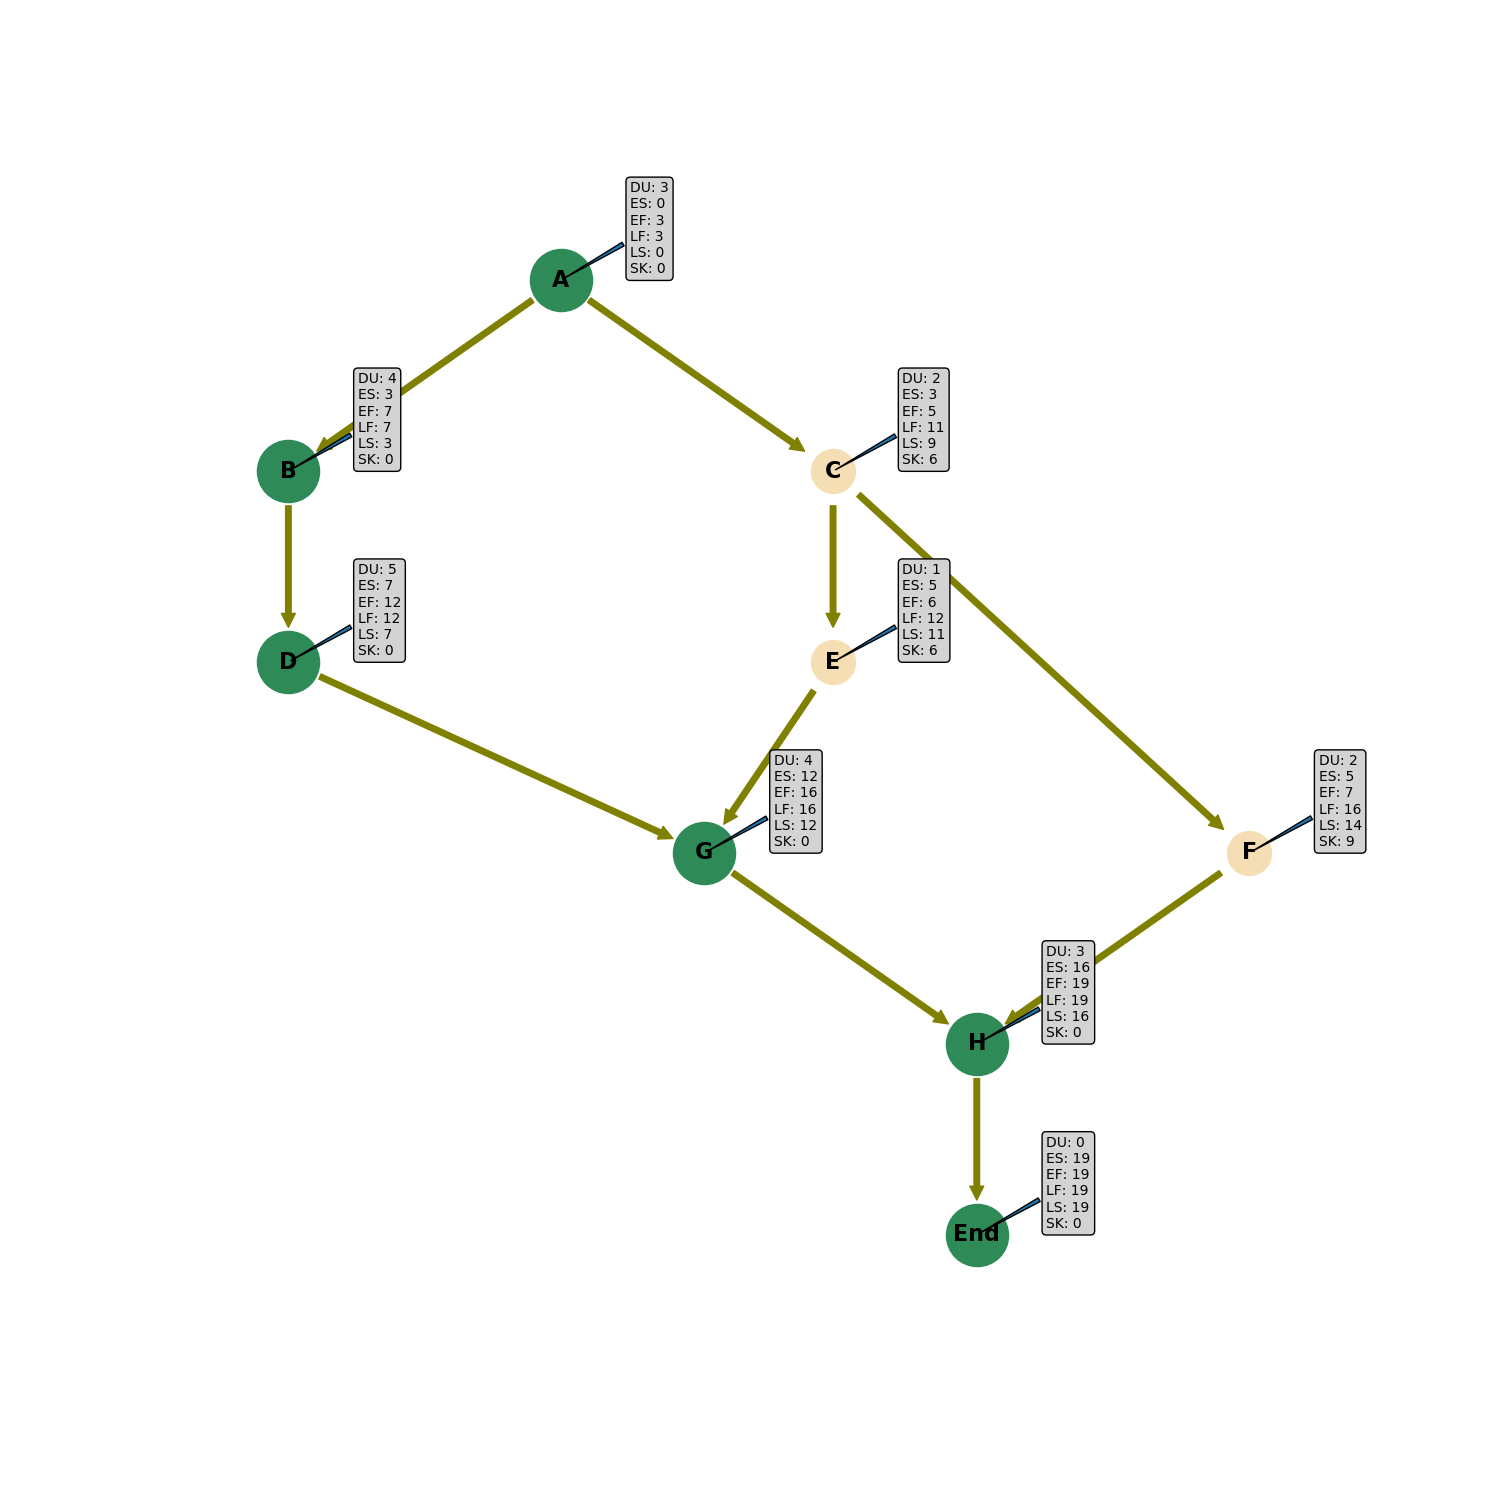 | Activity | Predecessors | Duration | | -------- | ------------ | -------- | | A | - | 3 | | B | A | 60 | | C | A | 5 | | D | A | 15 | | E | B | 6 | | F | D | 40 | | G | C E | 10 | | H | F | 7 | | I | G | 6 | | J | H I | 12 | ## 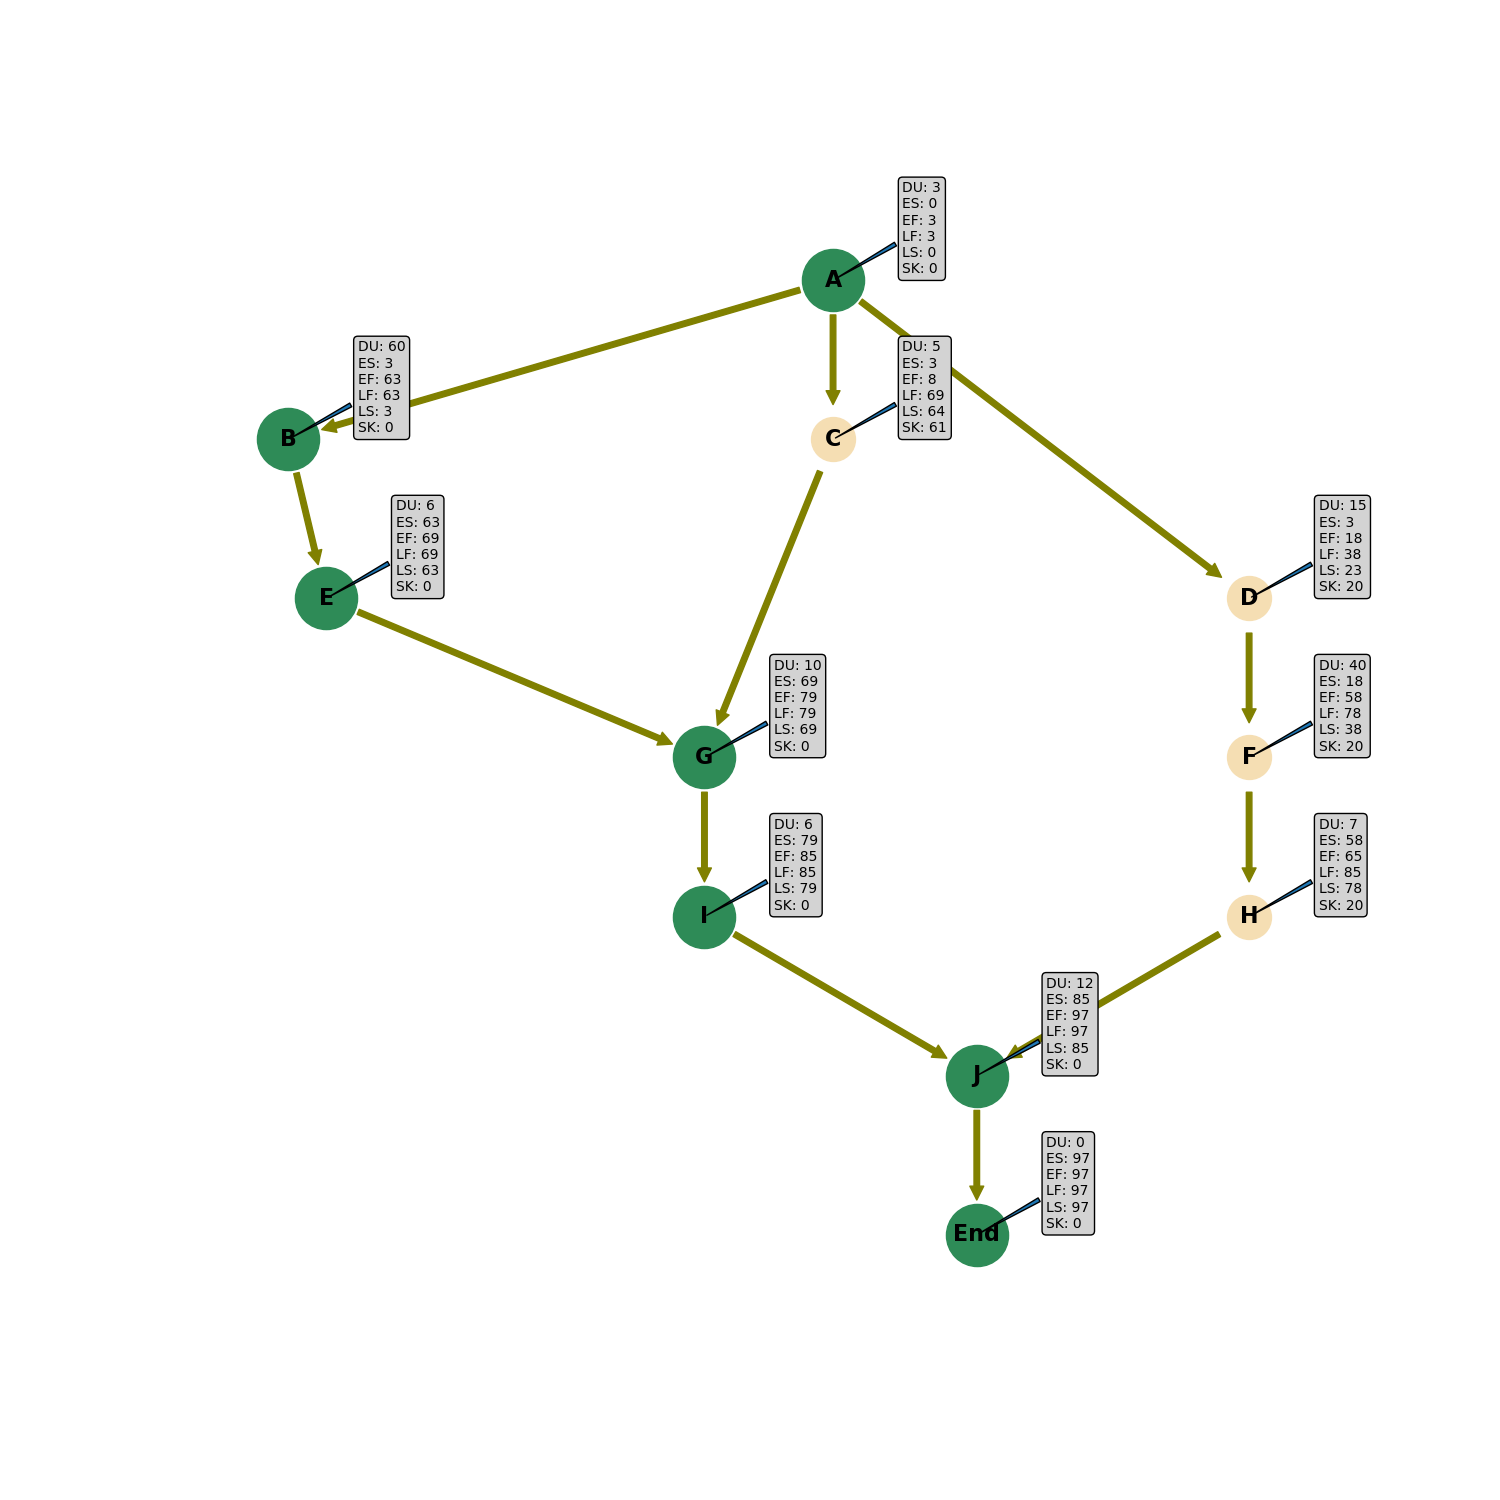 | Activity | Predecessors | Duration | | -------- | ------------ | -------- | | A | - | 7 | | B | A | 7 | | C | B | 14 | | D | A | 14 | | E | D | 14 | | F | D | 14 | | G | E | 21 | | H | F | 7 | | I | G | 7 | | J | C H | 1 | | K | E | 7 | | L | E | 7 | | M | L | 7 | | N | I J K M | 7 | ## 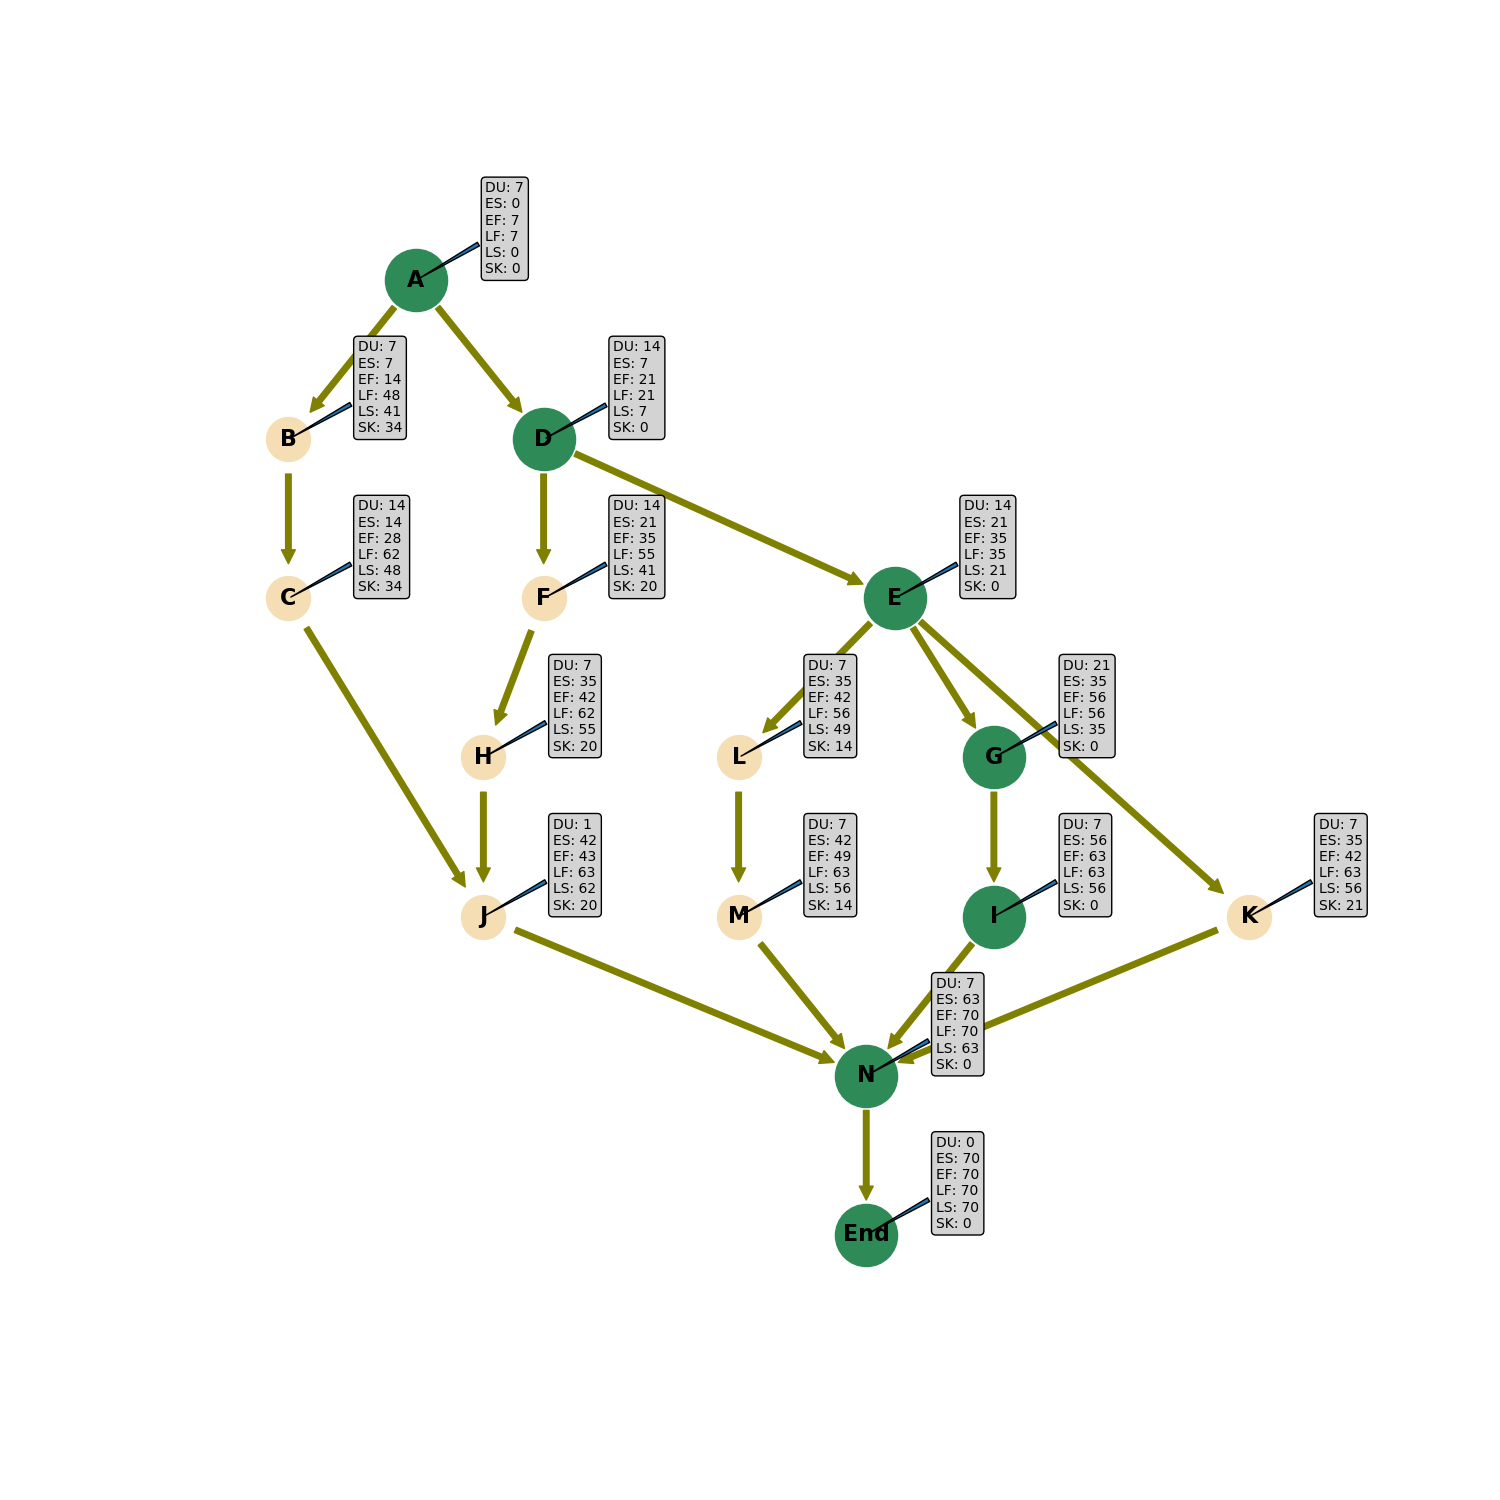 | Activity | Predecessors | Duration | | -------- | ------------ | -------- | | A | - | 2 | | B | A | 4 | | C | B | 3 | | D | B | 2 | | E | C D | 10 | | F | B | 4 | ## 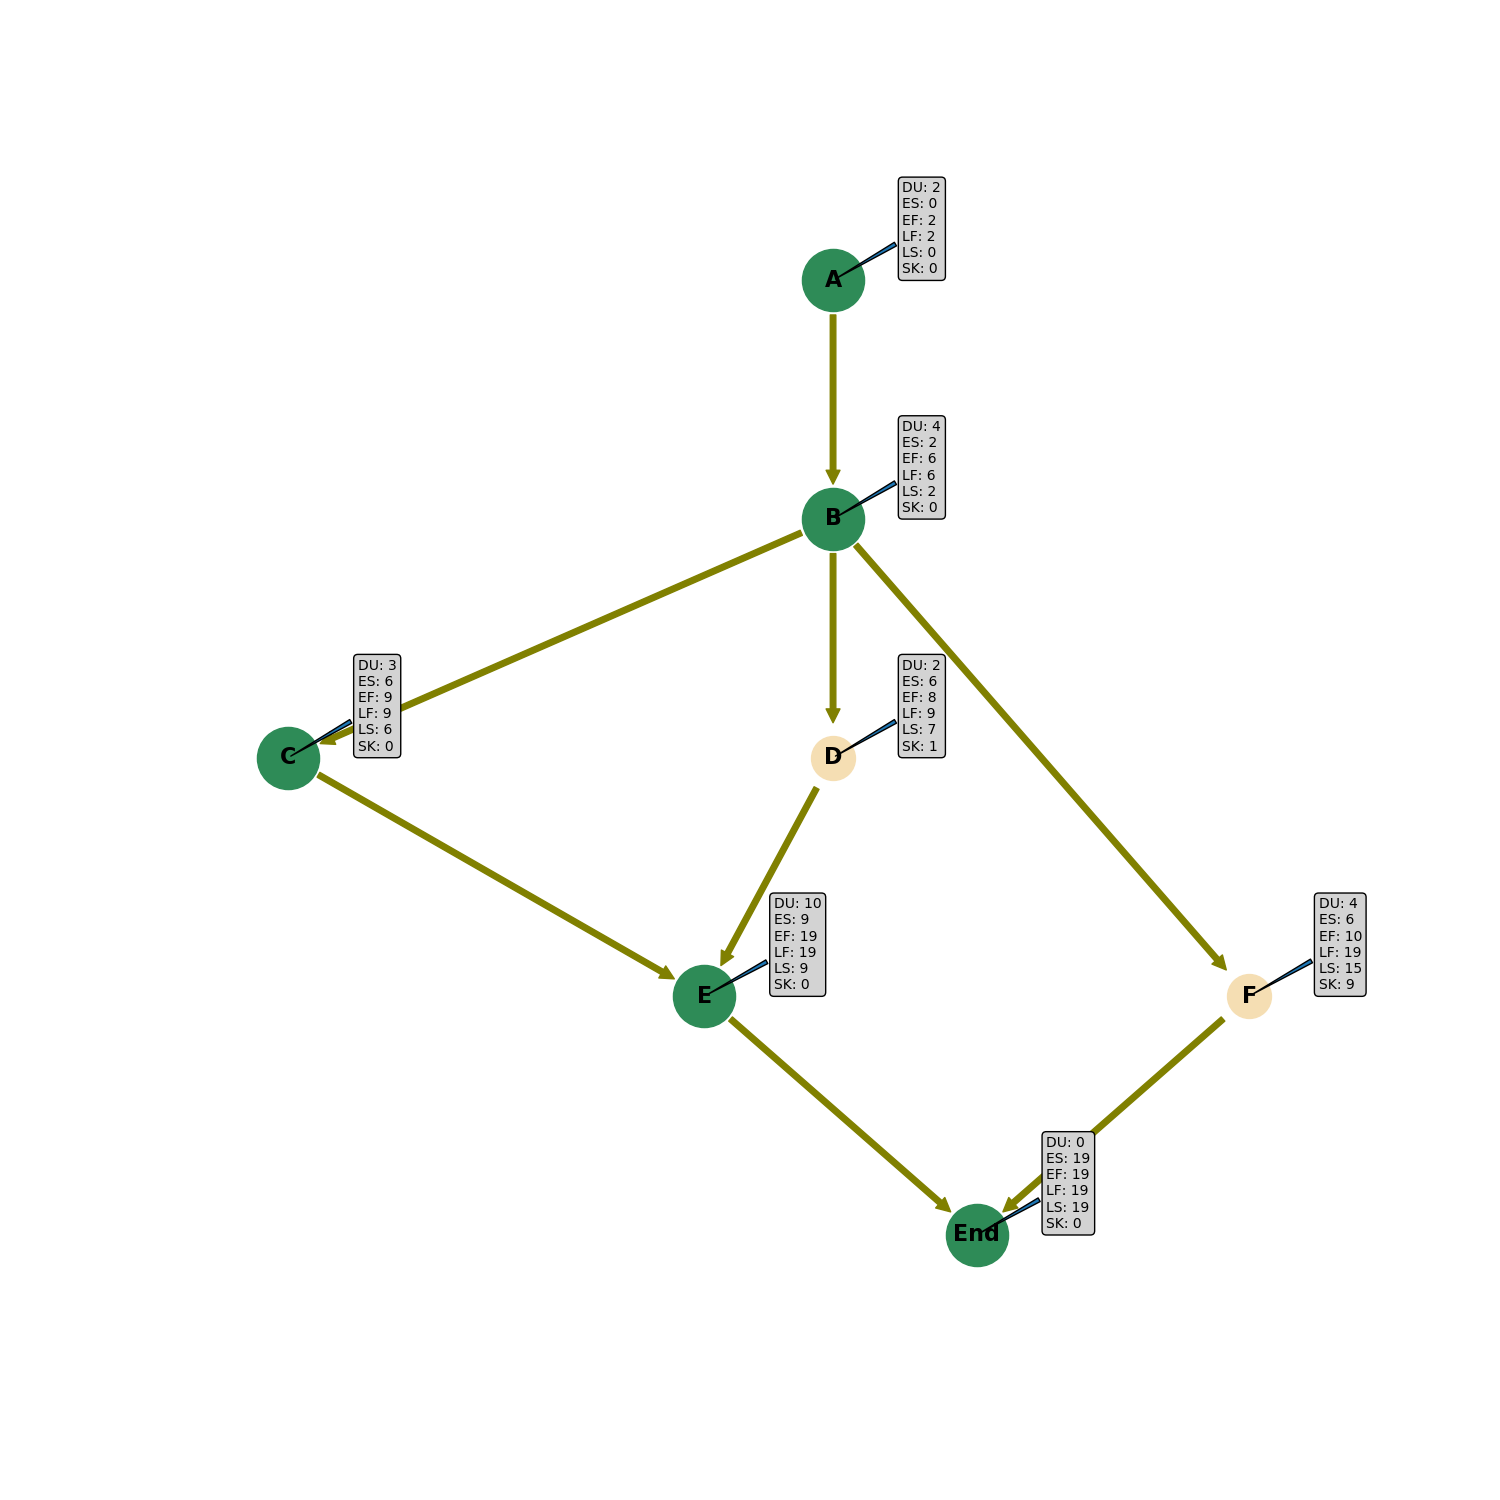 | Activity | Predecessors | Duration | | -------- | ------------ | -------- | | A | - | 16 | | B | - | 20 | | C | - | 30 | | D | B | 15 | | E | B | 10 | | F | D | 3 | | G | D | 16 | | H | A | 15 | | I | E F | 12 | ## 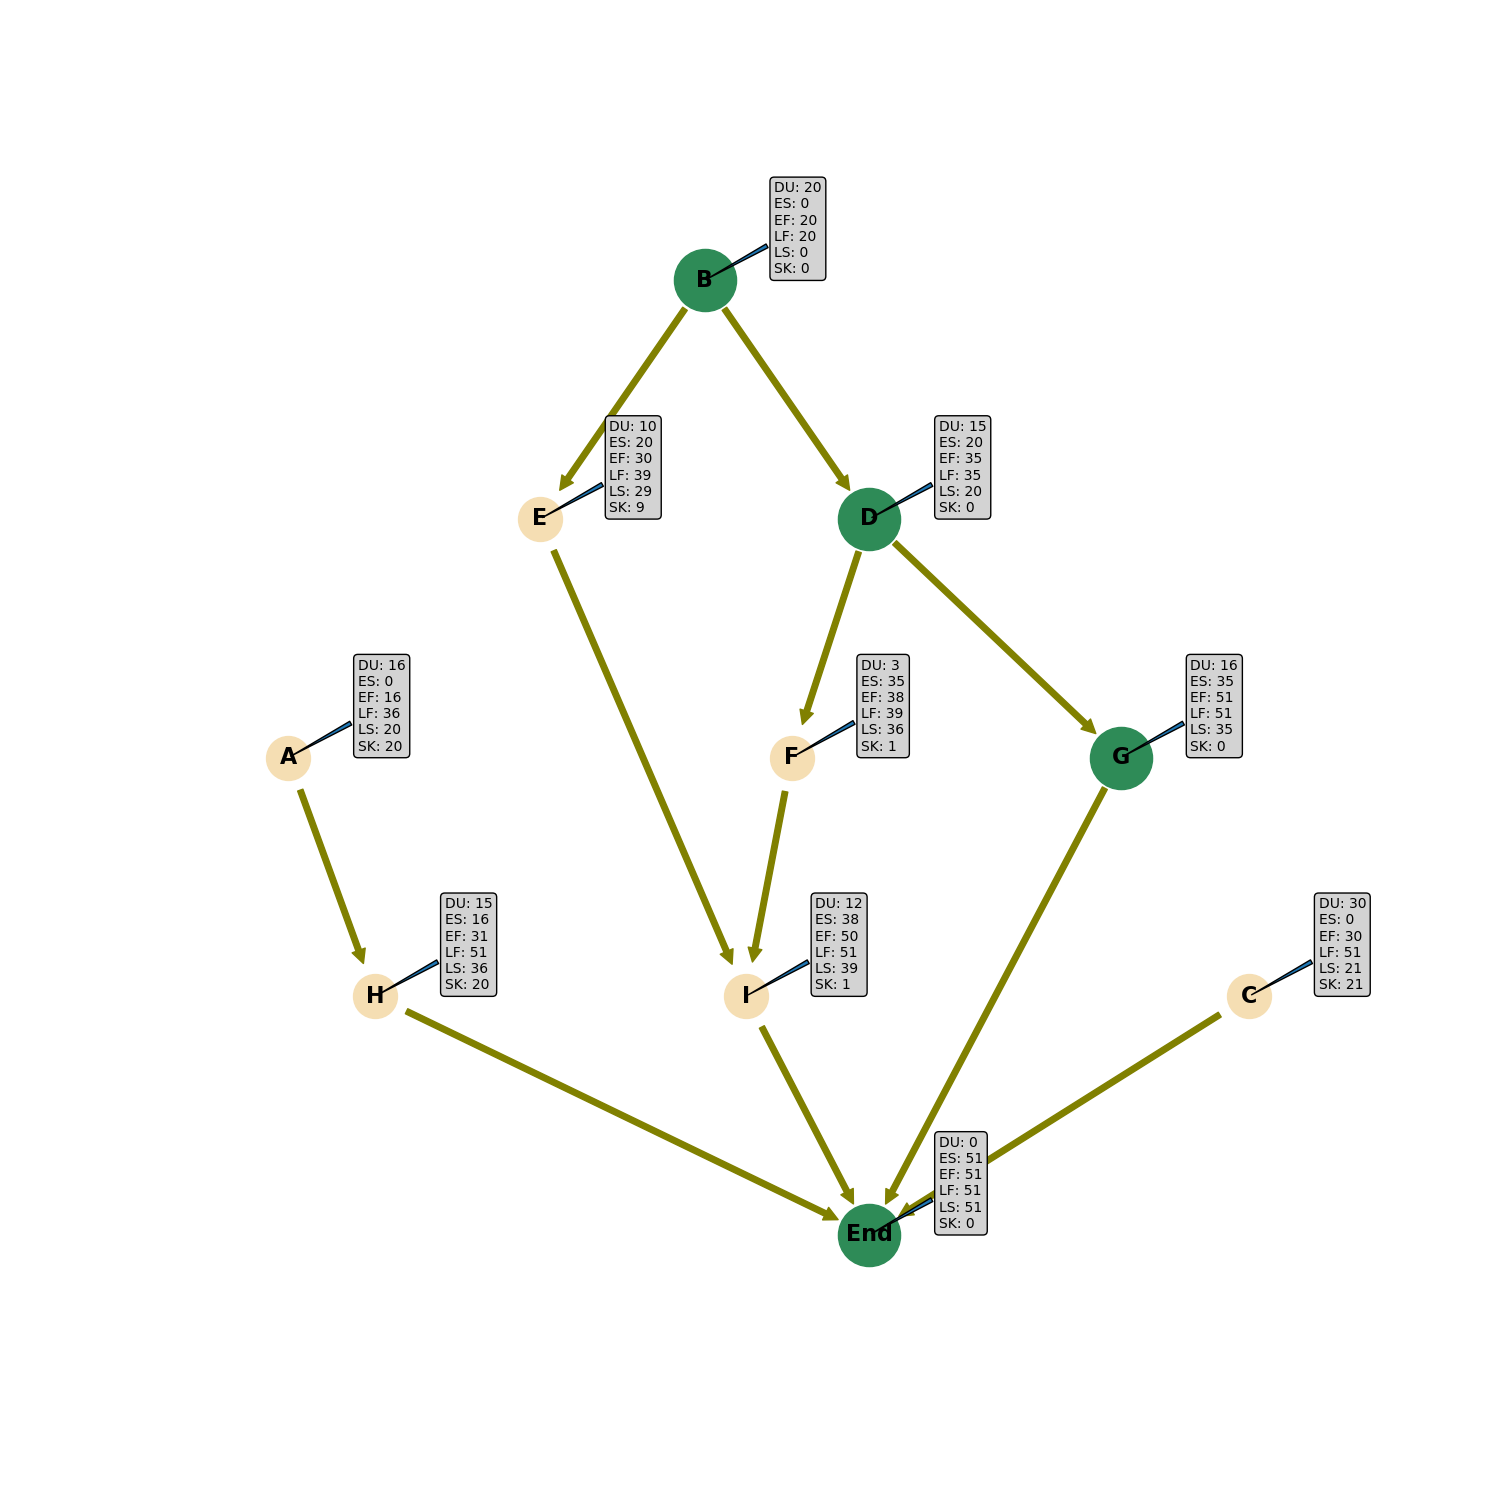 | Activity | Predecessors | Duration | | -------- | ------------ | -------- | | A | - | 8 | | B | - | 2 | | C | A | 5 | | D | B | 4 | | E | C D | 6 | | F | E | 7 | | G | D | 7 | | H | G | 5 | | I | E | 6 | ## 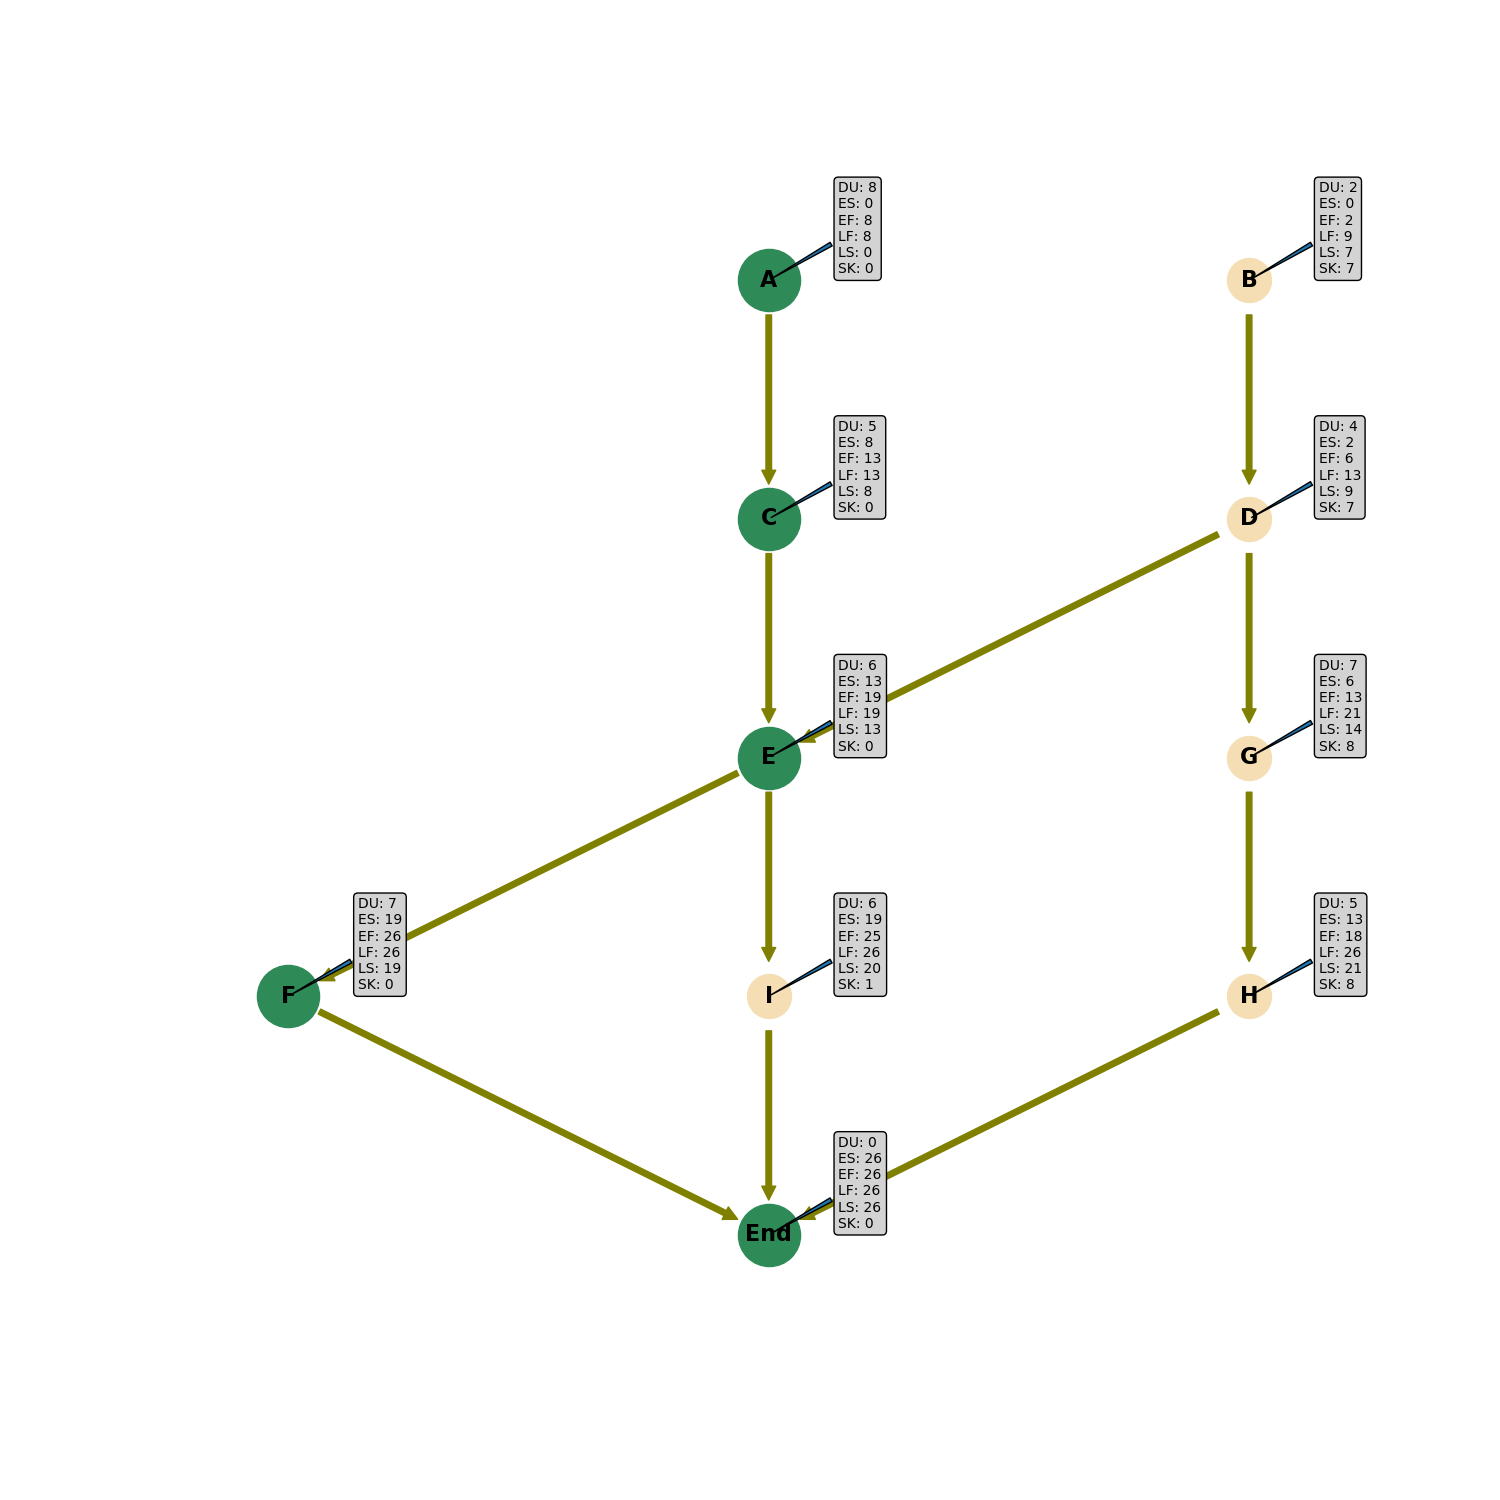 # Calculating Duration From Optimistic, Most probable and Pessimistic Time | Activity | Predecessors | Optimistic Time | Most probable Time | Pessimistic Time | | -------- | ------------ | --------------- | ------------------ | ---------------- | | A | - | 6 | 9 | 12 | | B | A | 3 | 4 | 11 | | C | A | 2 | 5 | 14 | | D | B C | 4 | 6 | 8 | | E | C | 1 | 1.5 | 5 | | F | E | 5 | 6 | 7 | | G | D | 7 | 8 | 15 | | H | B | 1 | 2 | 3 | ## 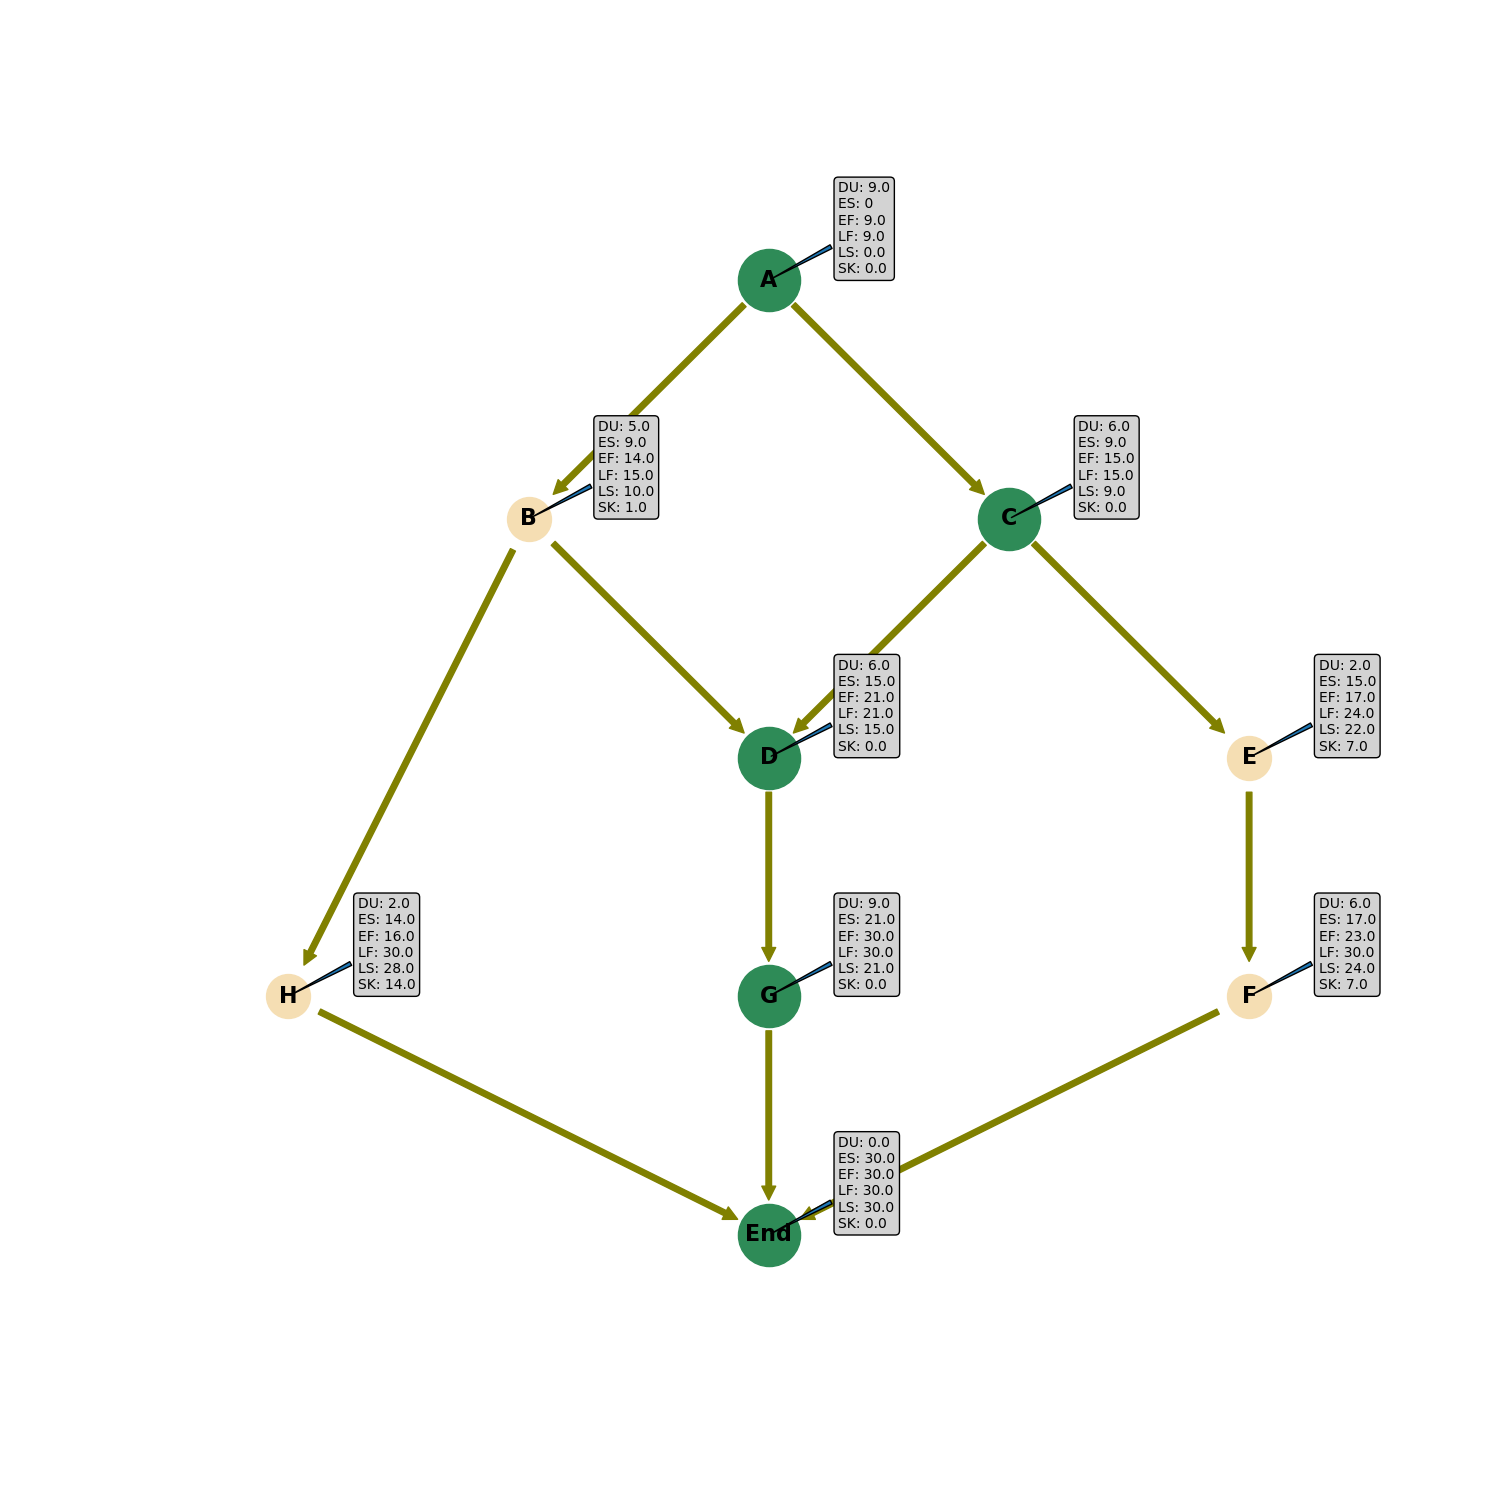 | Variance | 7.22222222 | | Standard Deviation | 2.68741925 | | Propability on 26 day | 4.9% | Used Tools: - Python -obviously- - Pandas: to import the data from csv files and store it in adjacency list for the graph - Networkx: to make the graph, nodes, edges, colors, arrows and everything - Graphviz: to calculate the positions for the graph nodes by "dot" engine - Matplotlib: to draw all these stuff
