KO
|
EN
gitlite — search
Search
#typescript
#ai-agents
#ai
#dsh-plugin
#deepseek-harness
#open-source
#cli
#claude-code
#codex
#developer-tools
#react
#windows
GGS
★ 102
Open GitHub ↗
Greedy Gaussian Segmentation
Download README (.md)
Explore Similar Repositories
RBCollectionViewBalancedColumnLayout
:
A UICollectionViewLayout that displays your cells in balanced columns.
aira
:
Autonomous intelligent robot agent (AIRA) project implements the standard of economic interaction between human-robot and robot-robot.
flake8-mypy
:
A plugin for flake8 integrating Mypy.
JsonPatch
:
[Archived] JSON PATCH library. Project moved to https://github.com/aspnet/AspNetCore
kernel-tools
:
:penguin: Kernels on Scaleway
// repository documentation
Was this content helpful?
★ 0
(0 ratings)
Select Rating:
★
★
★
★
★
Submit Feedback
Recent Feedback
×
Download README
Do you want to download the
README.md
file for
GGS
?
Download (.md)
# GGS Greedy Gaussian Segmentation (GGS) is a Python solver for efficiently segmenting multivariate time series data. For implementation details, please see our paper at [http://stanford.edu/~boyd/papers/ggs.html](http://stanford.edu/~boyd/papers/ggs.html). ---- The GGS Solver takes an n-by-T data matrix and breaks the T timestamps on an n-dimensional vector into segments over which the data is well explained as independent samples from a multivariate Gaussian distribution. It does so by formulating a covariance-regularized maximum likelihood problem and solving it using a greedy heuristic, with full details described in the [paper](http://stanford.edu/~boyd/papers/ggs.html). Download & Setup ====================== 1. Download the source code in the terminal by running: ``` git clone git@github.com:davidhallac/GGS.git ``` 2. Confirm that the code was properly downloaded by running: ``` cd GGS python helloworld.py ``` 3. To write your own Python function that uses ggs, simply make sure that `ggs.py` is in the same directory as your new file, and then add the following code to the beginning of your script: ``` from ggs import * ``` Supported Functions ====================== The GGS package has three main functions: ``` bps, objectives = GGS(data, Kmax, lamb) ``` Finds K breakpoints in the data for a given regularization parameter lambda **Inputs** data - a n-by-T data matrix, with T timestamps of an n-dimensional vector Kmax - the number of breakpoints to find lamb - regularization parameter for the regularized covariance **Returns** bps - List of lists, where element *i* of the larger list is the set of breakpoints found at *K = i* in the GGS algorithm objectives - List of the objective values at each intermediate step (for *K =* 0 to Kmax) ---- ``` meancovs = GGSMeanCov(data, breakpoints, lamb) ``` Finds the means and regularized covariances of each segment, given a set of breakpoints. **Inputs** data - a n-by-T data matrix, with T timestamps of an n-dimensional vector breakpoints - a list of breakpoint locations lamb - regularization parameter for the regularized covariance **Returns** meancovs - a list of (mean, covariance) tuples for each segment in the data ---- ``` cvResults = GGSCrossVal(data, Kmax=25, lambList = [0.1, 1, 10]) ``` Runs 10-fold cross validation, and returns the train and test set likelihood for every (K, lambda) pair up to Kmax **Inputs** data - a n-by-T data matrix, with T timestamps of an n-dimensional vector Kmax - the maximum number of breakpoints to run GGS on lambList - a list of regularization parameters to test **Returns** cvResults - list of (lamb, ([TrainLL],[TestLL])) tuples for each regularization parameter in lambList. Here, TrainLL and TestLL are the average per-sample log-likelihood across the 10 folds of cross-validation for all *K*'s from 0 to Kmax ---- Additional optional parameters (for all three functions above): features = [] - select a certain subset of columns in the data to operate on verbose = False - Print intermediate steps when running the algorithm Example Usage ====================== Running `financeExample.py` will yield the following plot, showing the objective (Equation 4 in the paper) vs. the number of breakpoints: 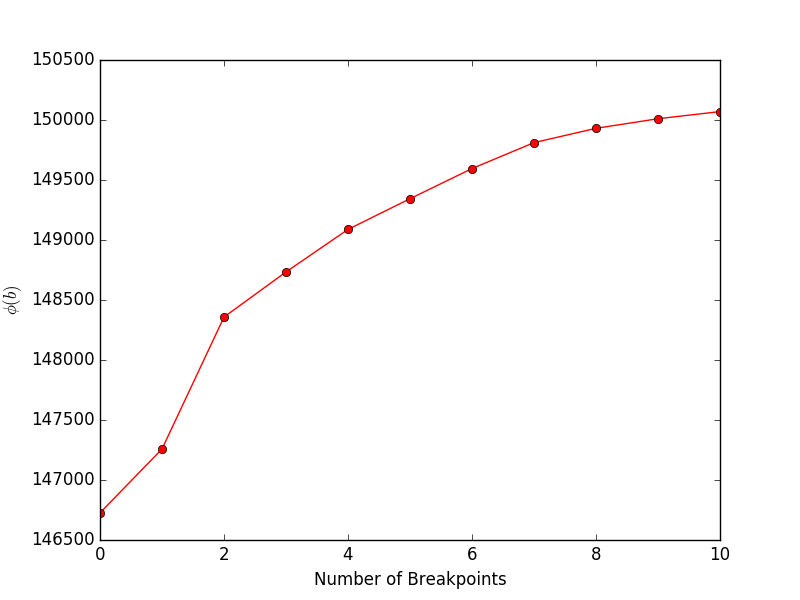 Once we have solved for the locations of the breakpoints, we can use the `FindMeanCovs()` function to find the means and covariances of each segment. In the example in `helloworld.py`, plotting the means, variances, and covariances of the three signals yields: 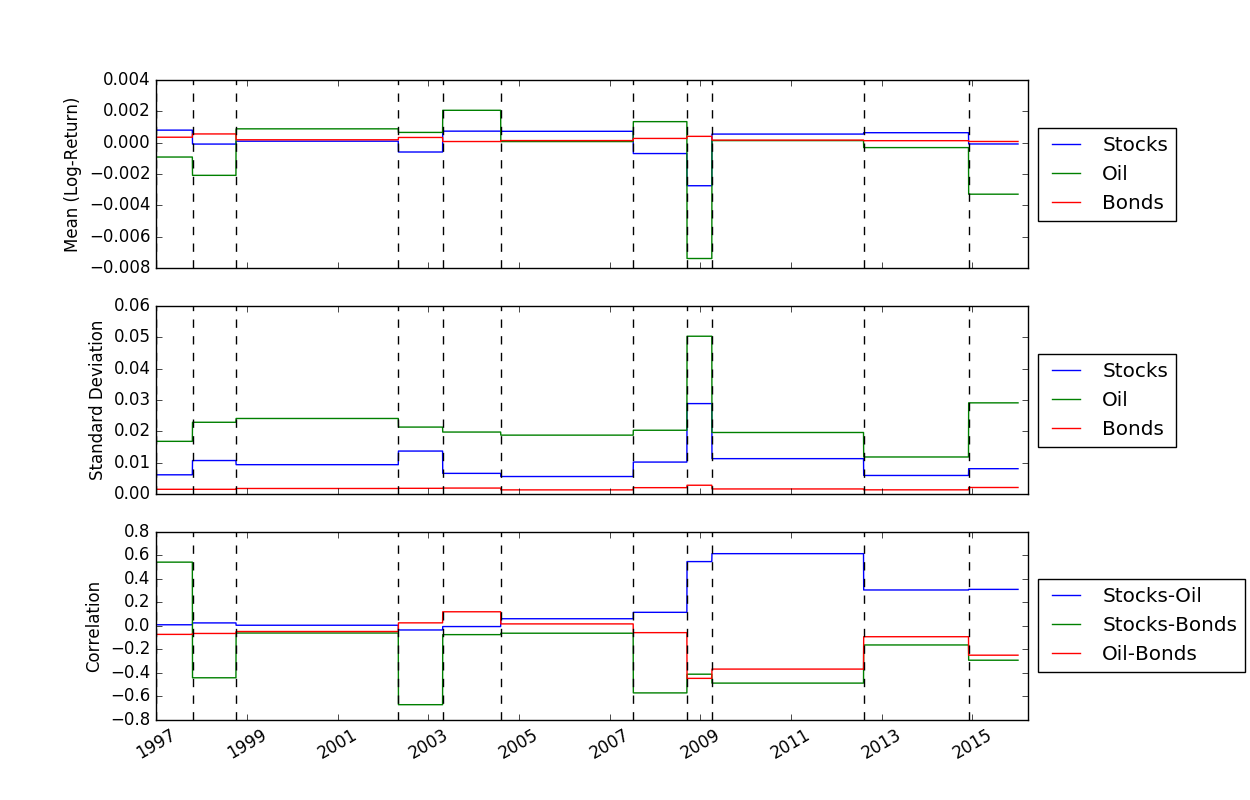 To run cross-validation, which can be useful in determining optimal values of K and lambda, we can use the following code to load the data, run the cross-validation, and then plot the test and train likelihood: ``` from ggs import * import numpy as np import matplotlib.pyplot as plt filename = "Returns.txt" data = np.genfromtxt(filename,delimiter=' ') feats = [0,3,7] #Run cross-validaton up to Kmax = 30, at lambda = 1e-4 maxBreaks = 30 lls = GGSCrossVal(data, Kmax=maxBreaks, lambList = [1e-4], features = feats, verbose = False) trainLikelihood = lls[0][1][0] testLikelihood = lls[0][1][1] plt.plot(range(maxBreaks+1), testLikelihood) plt.plot(range(maxBreaks+1), trainLikelihood) plt.legend(['Test LL','Train LL'], loc='best') plt.show() ``` The resulting plot looks like: 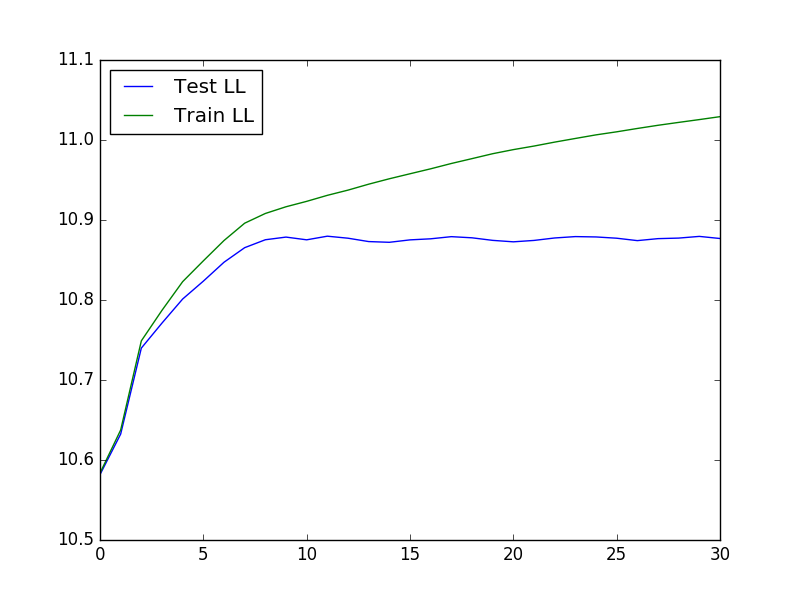 References ========== [Greedy Gaussian Segmentation of Time Series Data -- D. Hallac, P. Nystrup, and S. Boyd][ggs] [ggs]: http://stanford.edu/~boyd/papers/ggs.html "Greedy Gaussian Segmentation of Time Series Data -- D. Hallac, P. Nystrup, and S. Boyd" Authors ------ David Hallac, Peter Nystrup, and Stephen Boyd.
