KO
|
EN
gitlite — search
Search
#python
#java
#python3
#arduino
#golang
#machine-learning
#rust
#html
#flask
#javascript
#seismology
#nodejs
vcfstats
★ 74
Open GitHub ↗
Powerful statistics for VCF files
Download README (.md)
Explore Similar Repositories
csv2vcf
:
🔧 Simple script in python to convert CSV files to VCF
cerebra
:
A tool for fast and accurate summarizing of variant calling format (VCF) files
VCF2Dis
:
VCF2Dis: an ultra-fast and efficient tool to calculate pairwise genetic distance and construct population phylogeny from VCF files
VCF-Simplify
:
A python parser to simplify and build the VCF (Variant Call Format).
csv2vcf
:
A small command line tool to convert a CSV file to VCard (.vcf)
// repository documentation
Was this content helpful?
★ 0
(0 ratings)
Select Rating:
★
★
★
★
★
Submit Feedback
Recent Feedback
×
Download README
Do you want to download the
README.md
file for
vcfstats
?
Download (.md)
# vcfstats - powerful statistics for VCF files [![Pypi][1]][2] [![Github][3]][4] [![PythonVers][5]][2] [![docs][6]][13] ![github action][7] [![Codacy][9]][10] [![Codacy coverage][11]][10] [Documentation][13] | [CHANGELOG][12] ## Motivation There are a couple of tools that can plot some statistics of VCF files, including [`bcftools`][14] and [`jvarkit`][15]. However, none of them could: 1. plot specific metrics 2. customize the plots 3. focus on variants with certain filters R package [`vcfR`][19] can do some of the above. However, it has to load entire VCF into memory, which is not friendly to large VCF files. ## Installation ```shell pip install -U vcfstats ``` Or run with docker: ```shell docker run \ -w /vcfstats/workdir \ -v $(pwd):/vcfstats/workdir \ --rm justold/vcfstats:latest \ vcfstats \ --vcf myfile.vcf \ -o outputs \ --formula 'COUNT(1) ~ CONTIG' \ --title 'Number of variants on each chromosome' ``` ## Gallery ### Number of variants on each chromosome ```shell vcfstats --vcf examples/sample.vcf \ --outdir examples/ \ --formula 'COUNT(1) ~ CONTIG' \ --title 'Number of variants on each chromosome' \ --config examples/config.toml ``` 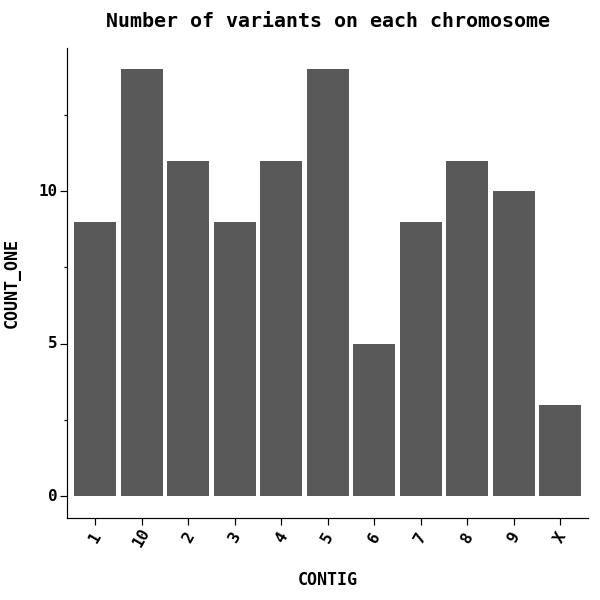 #### Changing labels and ticks `vcfstats` uses [`plotnine`][17] for plotting, read more about it on how to specify `--ggs` to modify the plots. ```shell vcfstats --vcf examples/sample.vcf \ --outdir examples/ \ --formula 'COUNT(1) ~ CONTIG' \ --title 'Number of variants on each chromosome (modified)' \ --config examples/config.toml \ --ggs 'scale_x_discrete(name ="Chromosome", \ limits=["1","2","3","4","5","6","7","8","9","10","X"]); \ ylab("# Variants")' ``` 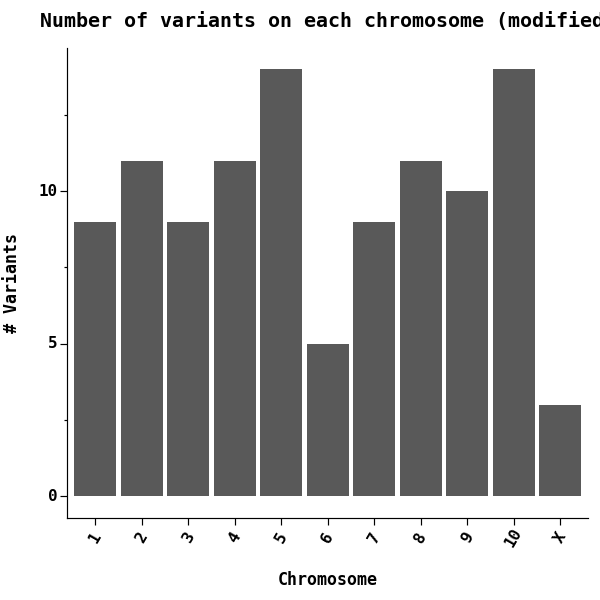 #### Number of variants on first 5 chromosome ```shell vcfstats --vcf examples/sample.vcf \ --outdir examples/ \ --formula 'COUNT(1) ~ CONTIG[1,2,3,4,5]' \ --title 'Number of variants on each chromosome (first 5)' \ --config examples/config.toml # or vcfstats --vcf examples/sample.vcf \ --outdir examples/ \ --formula 'COUNT(1) ~ CONTIG[1-5]' \ --title 'Number of variants on each chromosome (first 5)' \ --config examples/config.toml # or # require vcf file to be tabix-indexed. vcfstats --vcf examples/sample.vcf \ --outdir examples/ \ --formula 'COUNT(1) ~ CONTIG' \ --title 'Number of variants on each chromosome (first 5)' \ --config examples/config.toml -r 1 2 3 4 5 ``` 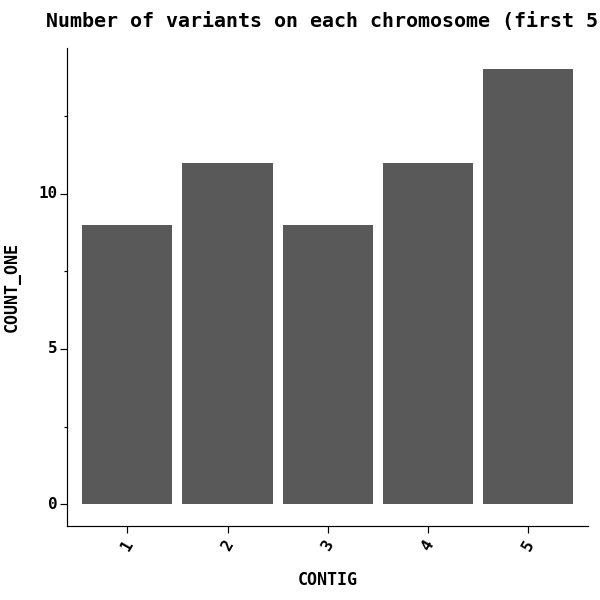 ### Number of substitutions of SNPs ```shell vcfstats --vcf examples/sample.vcf \ --outdir examples/ \ --formula 'COUNT(1, VARTYPE[snp]) ~ SUBST[A>T,A>G,A>C,T>A,T>G,T>C,G>A,G>T,G>C,C>A,C>T,C>G]' \ --title 'Number of substitutions of SNPs' \ --config examples/config.toml ``` 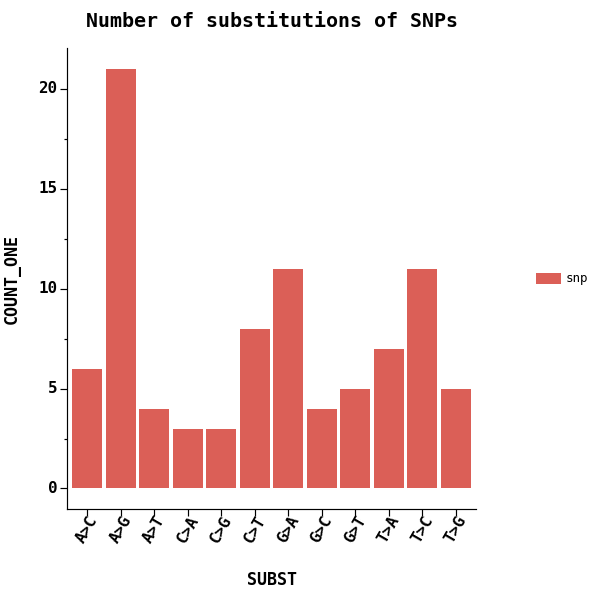 #### Only with SNPs PASS all filters ```shell vcfstats --vcf examples/sample.vcf \ --outdir examples/ \ --formula 'COUNT(1, VARTYPE[snp]) ~ SUBST[A>T,A>G,A>C,T>A,T>G,T>C,G>A,G>T,G>C,C>A,C>T,C>G]' \ --title 'Number of substitutions of SNPs (passed)' \ --config examples/config.toml \ --passed ``` 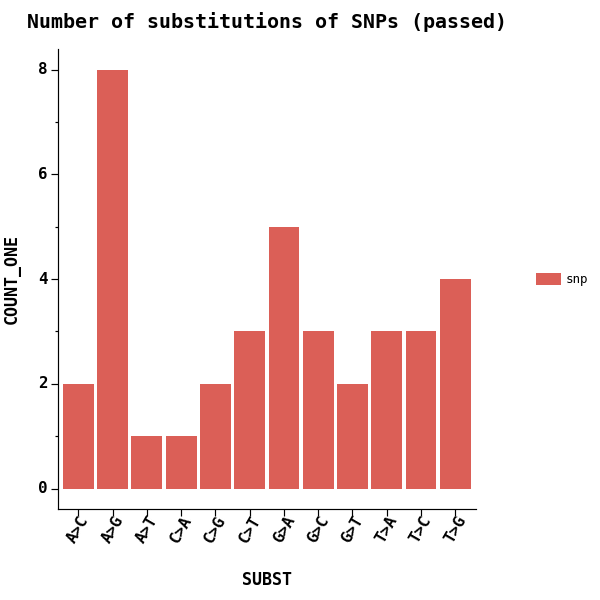 ### Alternative allele frequency on each chromosome ```shell # using a dark theme vcfstats --vcf examples/sample.vcf \ --outdir examples/ \ --formula 'AAF ~ CONTIG' \ --title 'Allele frequency on each chromosome' \ --config examples/config.toml --ggs 'theme_dark()' ``` 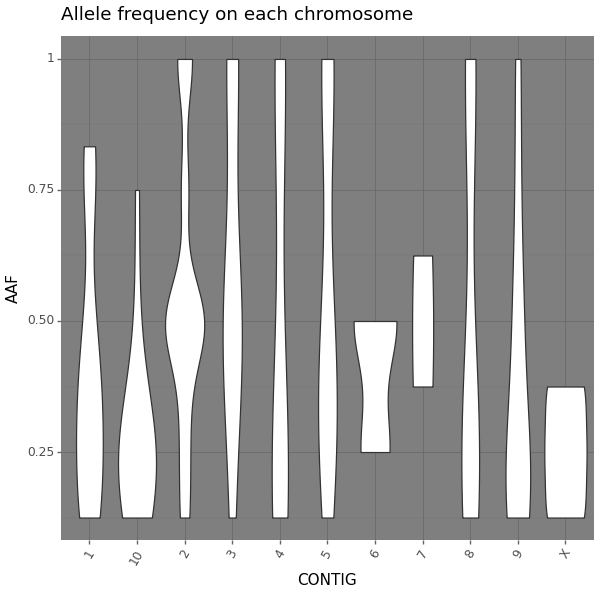 #### Using boxplot ```shell vcfstats --vcf examples/sample.vcf \ --outdir examples/ \ --formula 'AAF ~ CONTIG' \ --title 'Allele frequency on each chromosome (boxplot)' \ --config examples/config.toml \ --figtype boxplot ``` 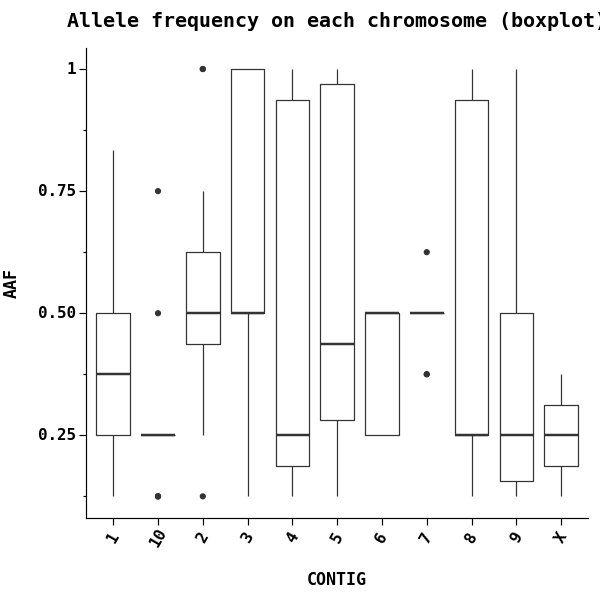 #### Using density plot/histogram to investigate the distribution: You can plot the distribution, using density plot or histogram ```shell vcfstats --vcf examples/sample.vcf \ --outdir examples/ \ --formula 'AAF ~ CONTIG[1,2]' \ --title 'Allele frequency on chromosome 1,2' \ --config examples/config.toml \ --figtype density ``` 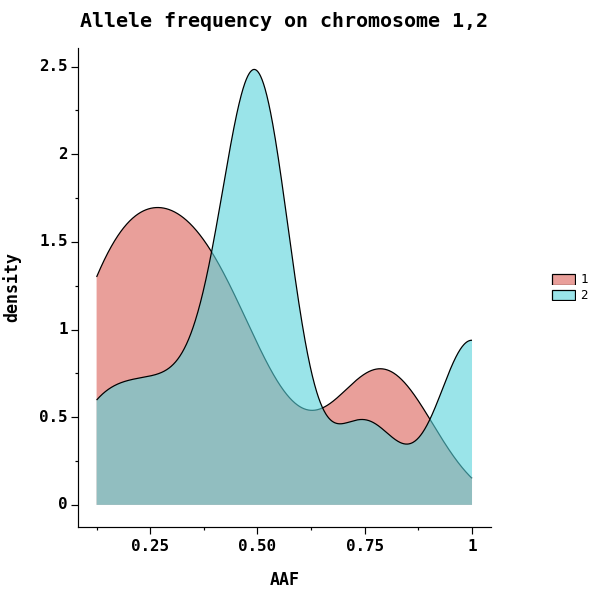 ### Overall distribution of allele frequency ```shell vcfstats --vcf examples/sample.vcf \ --outdir examples/ \ --formula 'AAF ~ 1' \ --title 'Overall allele frequency distribution' \ --config examples/config.toml ``` 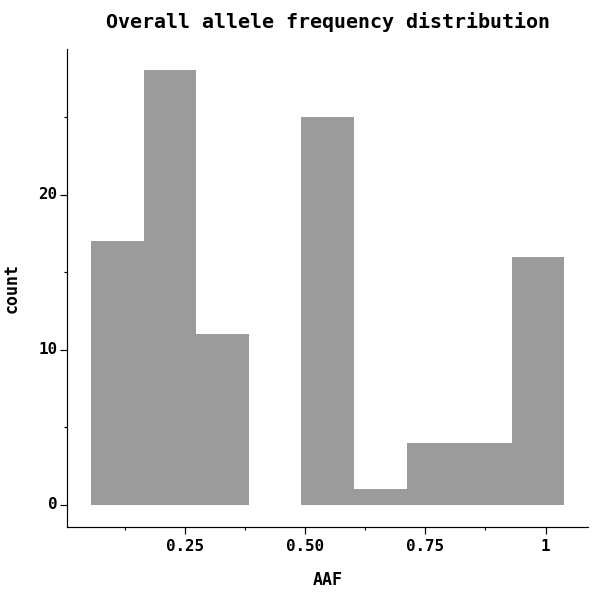 #### Excluding some low/high frequency variants ```shell vcfstats --vcf examples/sample.vcf \ --outdir examples/ \ --formula 'AAF[0.05, 0.95] ~ 1' \ --title 'Overall allele frequency distribution (0.05-0.95)' \ --config examples/config.toml ``` 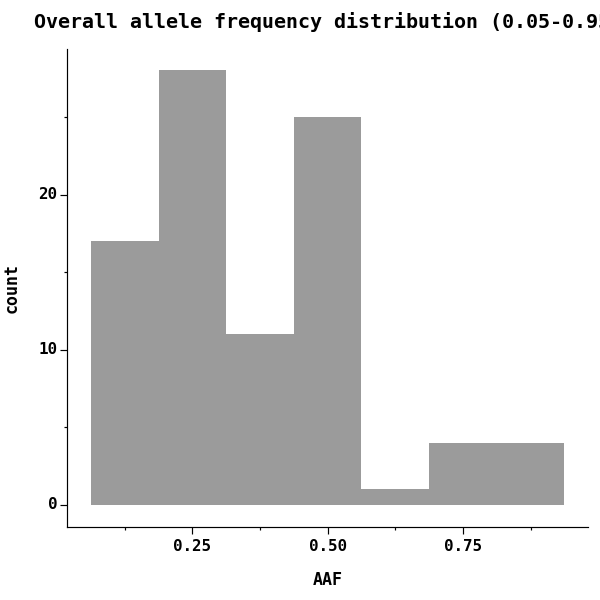 ### Counting types of variants on each chromosome ```shell vcfstats --vcf examples/sample.vcf \ --outdir examples/ \ --formula 'COUNT(1, group=VARTYPE) ~ CHROM' \ # or simply # --formula 'VARTYPE ~ CHROM' \ --title 'Types of variants on each chromosome' \ --config examples/config.toml ``` 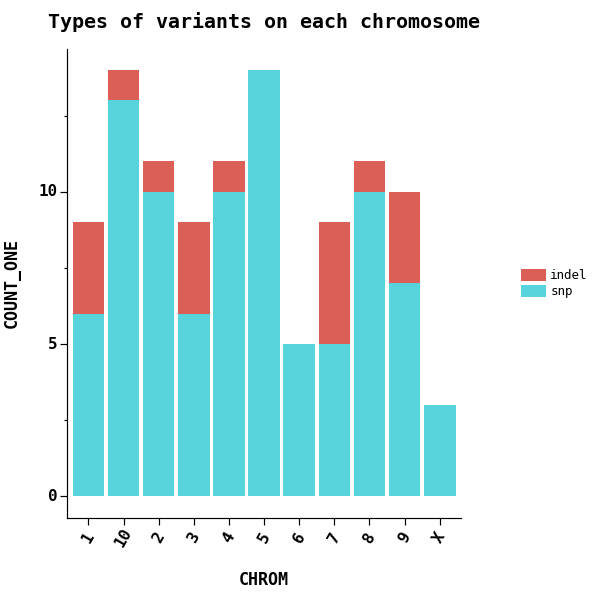 #### Using bar chart if there is only one chromosome ```shell vcfstats --vcf examples/sample.vcf \ --outdir examples/ \ --formula 'COUNT(1, group=VARTYPE) ~ CHROM[1]' \ # or simply # --formula 'VARTYPE ~ CHROM[1]' \ --title 'Types of variants on chromosome 1' \ --config examples/config.toml \ --figtype pie ``` 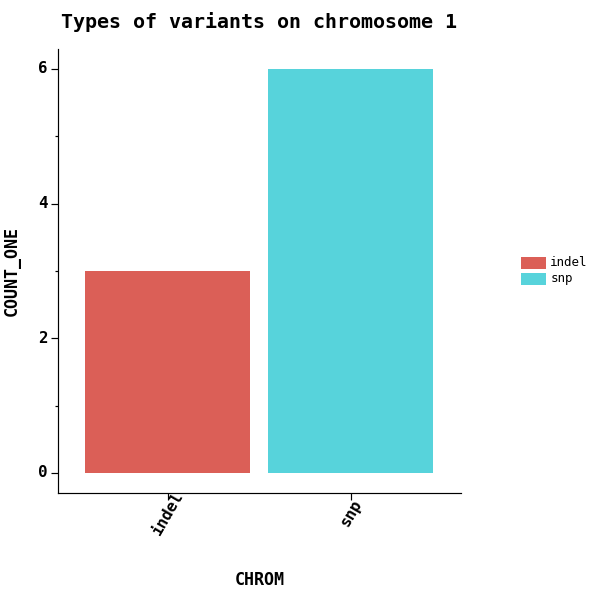 #### Counting variant types on whole genome ```shell vcfstats --vcf examples/sample.vcf \ --outdir examples/ \ # or simply # --formula 'VARTYPE ~ 1' \ --formula 'COUNT(1, group=VARTYPE) ~ 1' \ --title 'Types of variants on whole genome' \ --config examples/config.toml ``` 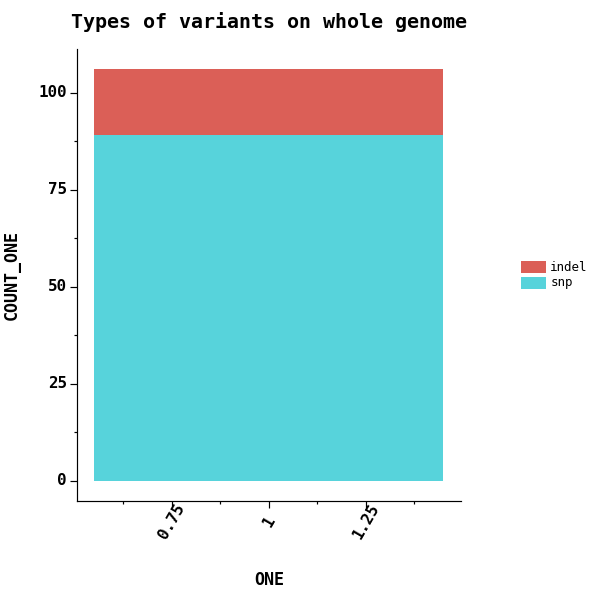 ### Counting type of mutant genotypes (HET, HOM_ALT) for sample 1 on each chromosome ```shell vcfstats --vcf examples/sample.vcf \ --outdir examples/ \ # or simply # --formula 'GTTYPEs[HET,HOM_ALT]{0} ~ CHROM' \ --formula 'COUNT(1, group=GTTYPEs[HET,HOM_ALT]{0}) ~ CHROM' \ --title 'Mutant genotypes on each chromosome (sample 1)' \ --config examples/config.toml ``` 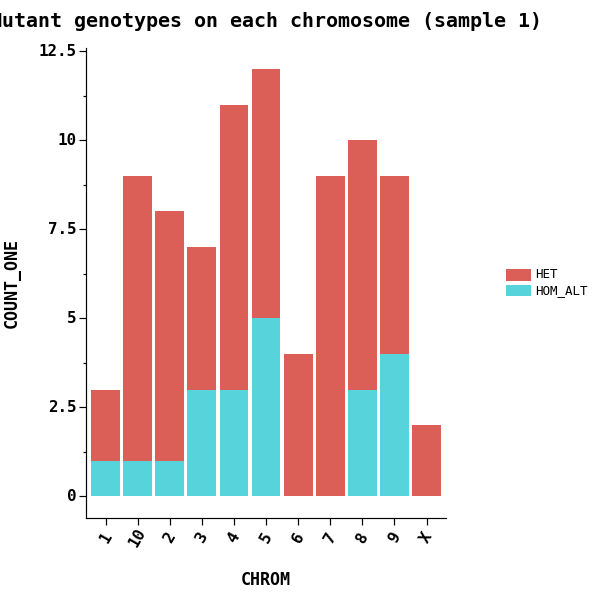 ### Exploration of mean(genotype quality) and mean(depth) on each chromosome for sample 1 ```shell vcfstats --vcf examples/sample.vcf \ --outdir examples/ \ --formula 'MEAN(GQs{0}) ~ MEAN(DEPTHs{0}, group=CHROM)' \ --title 'GQ vs depth (sample 1)' \ --config examples/config.toml ``` 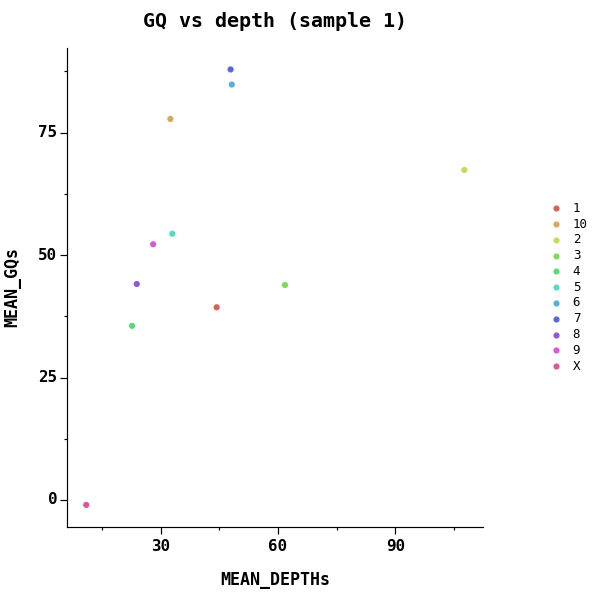 ### Exploration of depths for sample 1,2 ```shell vcfstats --vcf examples/sample.vcf \ --outdir examples/ \ --formula 'DEPTHs{0} ~ DEPTHs{1}' \ --title 'Depths between sample 1 and 2' \ --config examples/config.toml ``` 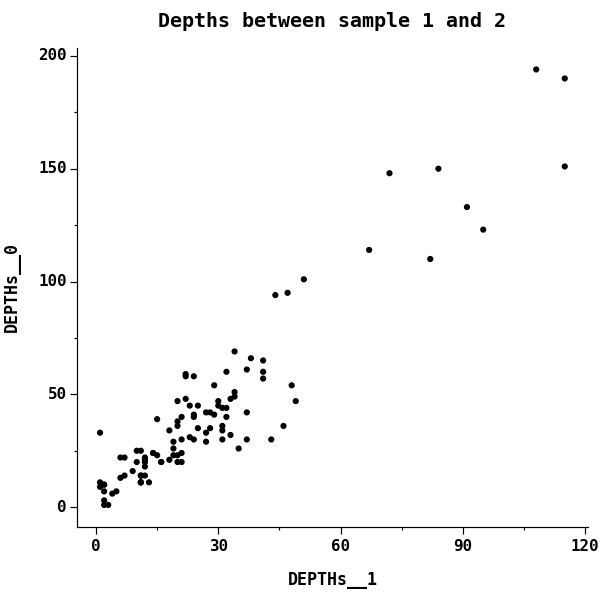 See more examples: [https://github.com/pwwang/vcfstats/issues/15#issuecomment-1029367903](https://github.com/pwwang/vcfstats/issues/15#issuecomment-1029367903) [1]: https://img.shields.io/pypi/v/vcfstats?style=flat-square [2]: https://pypi.org/project/vcfstats/ [3]: https://img.shields.io/github/v/tag/pwwang/vcfstats?style=flat-square [4]: https://github.com/pwwang/vcfstats [5]: https://img.shields.io/pypi/pyversions/vcfstats?style=flat-square [6]: https://img.shields.io/github/actions/workflow/status/pwwang/vcfstats/docs.yml?label=docs&style=flat-square [7]: https://img.shields.io/github/actions/workflow/status/pwwang/vcfstats/build.yml?style=flat-square [9]: https://img.shields.io/codacy/grade/c8c8bfa8c5e9443bbf268a0a7c6f206d?style=flat-square [10]: https://app.codacy.com/gh/pwwang/vcfstats/ [11]: https://img.shields.io/codacy/coverage/c8c8bfa8c5e9443bbf268a0a7c6f206d?style=flat-square [12]: https://pwwang.github.io/vcfstats/CHANGELOG/ [13]: https://pwwang.github.io/vcfstats/ [14]: https://samtools.github.io/bcftools/bcftools.html#stats [15]: http://lindenb.github.io/jvarkit/VcfStatsJfx.html [17]: https://plotnine.readthedocs.io/en/stable/ [19]: https://knausb.github.io/vcfR_documentation/visualization_1.html
