KO
|
EN
gitlite — search
Search
#typescript
#ai-agents
#ai
#dsh-plugin
#deepseek-harness
#open-source
#claude-code
#codex
#cli
#developer-tools
#react
#windows
vectorvector
★ 29
Open GitHub ↗
tooling for vectorizing the planet
Download README (.md)
Explore Similar Repositories
terrarium
:
A series of experiments on terrain and elevation data for Tangram
my-terrarium
:
A simple drag and drop meditation
harp-terrain-datasource
:
Render and style 3D terrain
terrarium-rust-guest
:
The "http_guest" crate used by Fastly Labs Terrarium https://wasm.fastlylabs.com/
terrarium-templates
:
Template and example projects for Fastly Labs Terrarium https://wasm.fastlylabs.com
// repository documentation
Was this content helpful?
★ 0
(0 ratings)
Select Rating:
★
★
★
★
★
Submit Feedback
Recent Feedback
×
Download README
Do you want to download the
README.md
file for
vectorvector
?
Download (.md)
## vectorvector vectorvector provides tooling for vectorizing the planet. Produces contour tiles, hillshade and terrarium tiles from an elevation data set. ## Features Provides a command-line tool for generating slippy map tiles from elevation data. ### Tile Outputs * **Hillshade** - raster hillshade using the Horn Algorithm[^1] * **Contour Lines** - vector contour lines using the Marching Squares algorithm[^2]. Contour lines are reduced using the Ramer–Douglas–Peucker algorithm[^6][^7] * **Terrarium Tiles** - raster elevation tiles in Terrarium format[^3] ### Elevation Inputs * ALOS AW3D30[^8] elevation data in GeoTIFF[^5] format. Tested using data from [https://www.eorc.jaxa.jp](https://www.eorc.jaxa.jp/ALOS/en/dataset/aw3d30/aw3d30_e.htm) * SRTM[^4] elevation data in GeoTIFF[^5] format. Tested using data from [srtm.csi.cgiar.org](https://srtm.csi.cgiar.org/) ## Example 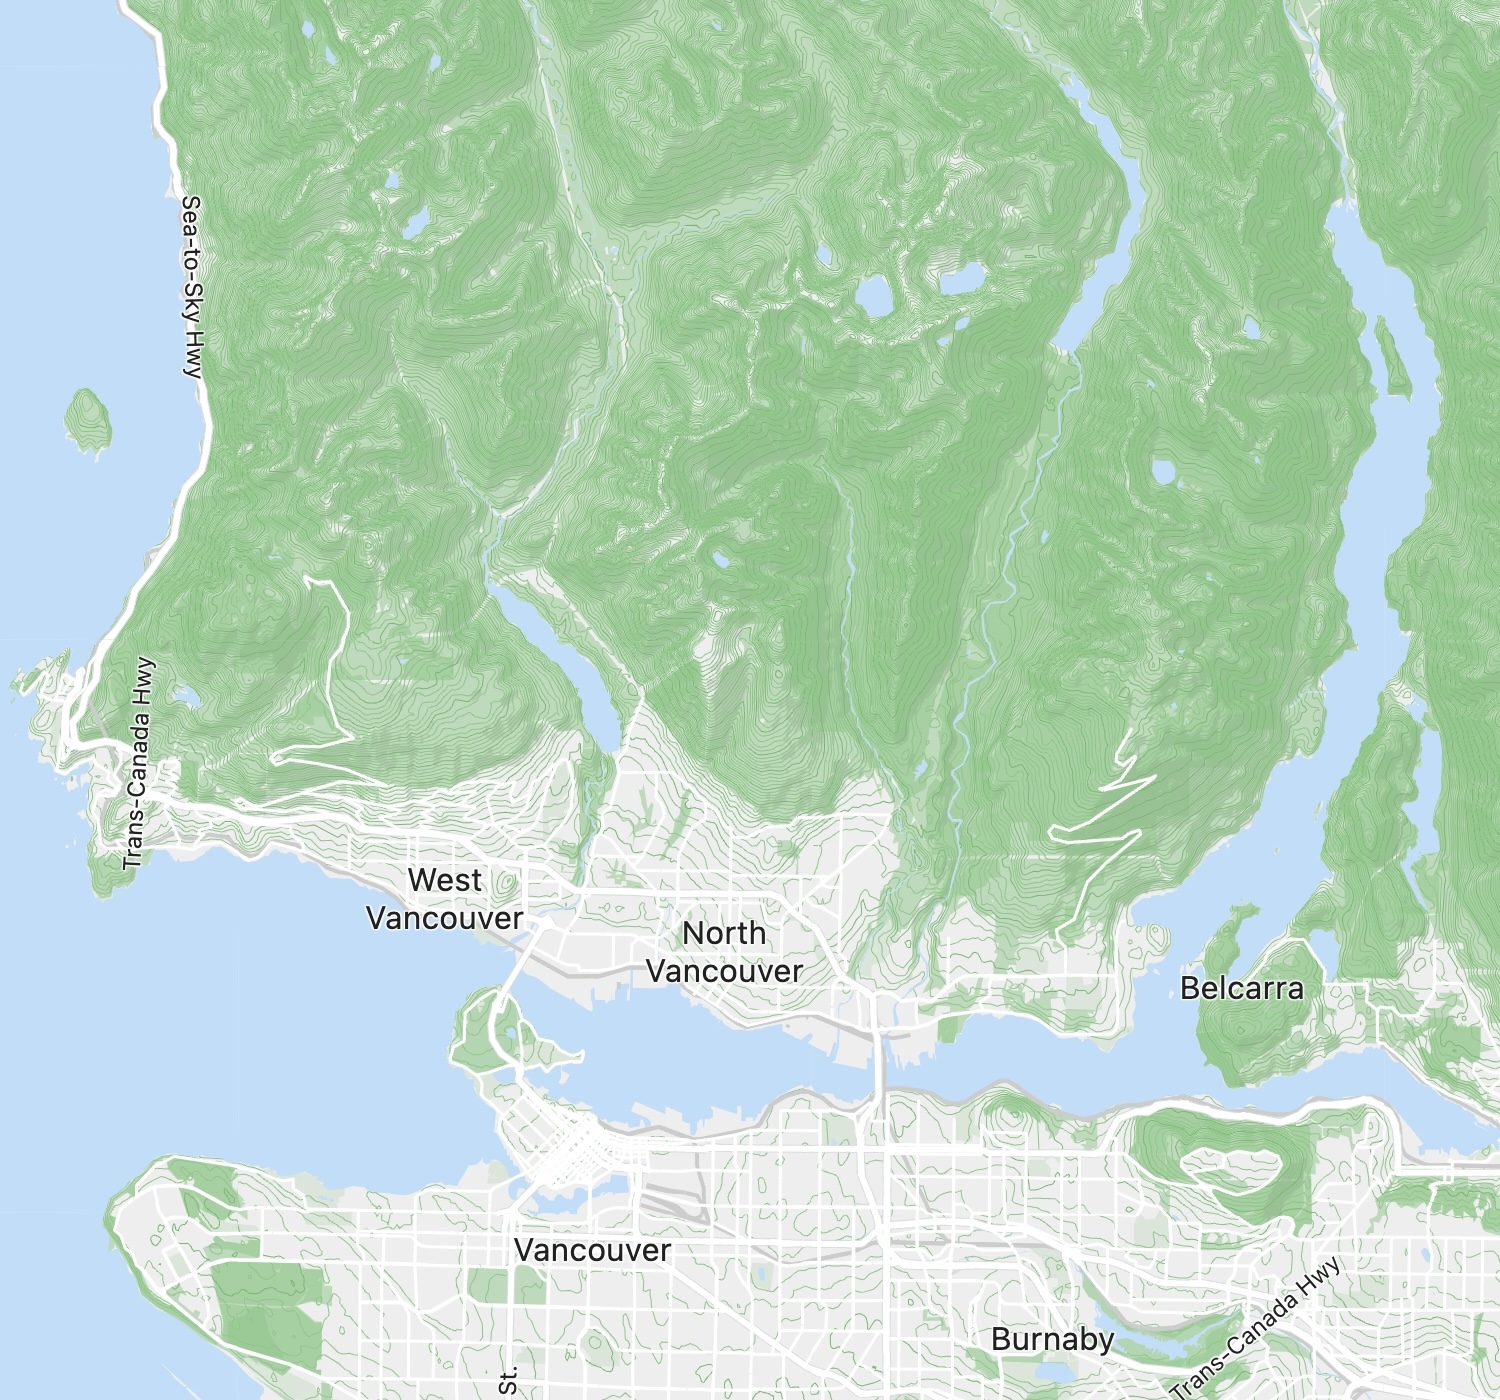 Vector styling included the following for hillshade and contour lines: <details><summary>(click to expand JSON style)</summary> ```json { "layers": [ { "id": "hillshade", "type": "raster", "source": "hillshade", "source-layer": "hillshade", "minzoom": 6, "maxzoom": 15, "paint": { "raster-opacity": [ "interpolate", [ "linear" ], [ "zoom" ], 6, 0.8, 11, 0.4, 14, 0.2, 15, 0.1 ] } }, { "id": "contour_major", "type": "line", "source": "contour", "source-layer": "contours", "minzoom": 9, "maxzoom": 15, "filter": [ "all", [ ">", "ele", 10 ], [ "==", "level", 1 ] ], "paint": { "line-color": "#66bb6a", "line-width": { "stops": [ [ 12, 0.5 ], [ 13, 1 ] ] } } }, { "id": "contour_medium", "type": "line", "source": "contour", "source-layer": "contours", "minzoom": 9, "maxzoom": 15, "filter": [ "all", [ ">", "ele", 10 ], [ "==", "level", 0 ] ], "paint": { "line-color": "#81c784", "line-width": { "stops": [ [ 10, 0.25 ], [ 11, 0.5 ], [ 16, 1 ] ] } } } ] } ``` </details> ## Build To build the package, use the following command: ```shell $ mvn package ``` The build creates a jar with all dependencies in `target/vectorvector-cli.jar` ## Usage Sample usage: ```shell $ java -jar target/vectorvector-cli.jar --outputFormat files --data elevation/data/tif --output elevation/output --area pnw --vector=true --hillshadeRaster=true ``` In this example `pnw` refers to the Pacific Northwest Running with `--help` will generate usage help: ```txt java -jar target/vectorvector-cli.jar --help Usage: java --jar vectorvector-cli.jar [-h] [--hillshadeRaster] [--terrarium] [--vector] [-a=<area>] -d=<dataDir> [--dataFormat=<dataFormat>] [--epsilon=<contourEpsilon>] -f=<outputFormat> [-maxX=<maxX>] [-maxY=<maxY>] [-maxZ=<maxZ>] [-minX=<minX>] [-minY=<minY>] [-minZ=<minZ>] -o=<outputDir> -a, --area=<area> The name of an area, which specifies a bounds for tile generation (minZ, maxZ, minX, maxX, minY, maxY). If specified, the area supersedes all Z/X/Y options. Must be one of wholeworld, world, northamerica, southamerica, centralamerica, europe, newzealand, australia, vancouver, deepcove, pnw, sanfrancisco, newyork, paris, rome, tokyo, mallorca, debug -d, --data=<dataDir> The data directory containing elevation data in GeoTIFF format --dataFormat=<dataFormat> The format of data in the data directory --epsilon=<contourEpsilon> Specifies the epsilon value to apply to contour lines for reducing the number of points using the Ramer–Douglas–Peucker algorithm. A higher value simplifies the lines more by removing points, while a lower value retains more detail. The default value is 3. Set to 0 to disable line simplification. -f, --outputFormat=<outputFormat> The format of the output, must be one of files, mbtiles -h, --help display this help message --hillshadeRaster Generates hillshade raster tiles, which simulate the shading effects of the sun on the terrain to enhance visual representation of elevation data. Defaults to true -maxX=<maxX> Specifies the maximum longitude (X coordinate) for the tile area at the minZ zoom level. Defaults to 63 -maxY=<maxY> Specifies the maximum latitude (Y coordinate) for the tile area at the minZ zoom level. Defaults to 43 -maxZ=<maxZ> The maximum zoom level for which tiles are generated. Defaults to 12 -minX=<minX> Specifies the minimum longitude (X coordinate) for the tile area at the minZ zoom level. Defaults to 63 -minY=<minY> Specifies the minimum latitude (Y coordinate) for the tile area at the minZ zoom level. Defaults to 13 -minZ=<minZ> The minimum zoom level for which tiles are generated. Defaults to 6 -o, --output=<outputDir> Specifies the directory where the generated output files will be saved. Defaults to . --terrarium Generates Terrarium-style raster tiles, commonly used for rendering 3D-like terrain features. Defaults to false --vector Generates vector tiles with contour lines. Defaults to true ``` ### Disk Space Approximate disk space requirements: * GeoTIFF elevation data of the planet: 59G * mbtiles output (vector and hillshade): 67G You'll need a total of about 126 GB free space before starting, or about 200 GB if you're also generating pmtiles. ### Alternate Formats To convert mbtiles to [pmtiles](https://docs.protomaps.com/pmtiles/): ```sh $ brew install pmtiles $ pmtiles convert world-hillshade.mbtiles world-hillshade.pmtiles ``` ## Benchmark Vector contour lines and raster hillshade for the world completed in 6 hours 51 minutes with SRTM source data, and about 14 hours with AW3D30 source data. The process run on an Apple MacBook Pro with an M2 chip having 12 cores and 64 GB RAM. | file | SRTM size | AW3D30 size | |-------------------|-----------|-------------| | hillshade.mbtiles | 15.5 GB | 28.1 GB | | vector.mbtiles | 51.2 GB | 70.1 GB | Command line options: AW3D30: ```txt -Xmx42g --outputFormat mbtiles --data data/alos --dataFormat=aw3d30 --output output --area world ``` SRTM: ```txt -Xmx42g --outputFormat mbtiles --data data/tif --dataFormat=srtm --output output --area world ``` Machine spec: ```txt Model Name: MacBook Pro Model Identifier: Mac14,5 Chip: Apple M2 Max Total Number of Cores: 12 (8 performance and 4 efficiency) Memory: 64 GB ``` ## Why vectorvector is an experiment to see if we can produce high quality tiles for the whole planet in a few hours. Goals: * high quality output * can generate the planet in < 6 hours on consumer hardware * high degree of customizability * optimal development experience with a fast feedback loop * facilitate learning about mapping and algorithms ## See Also The following tools and libraries provide complimentary functionality: * [protomaps](https://github.com/protomaps) * [planetiler](https://github.com/onthegomap/planetiler) * [tippecanoe](https://github.com/felt/tippecanoe) ## Alternatives The following tools and libraries are more mature, have more features and may be more suited to your use-case: * QGIS [github.com/qgis/QGIS](https://github.com/qgis/QGIS) * GDAL (Geospatial Data Abstraction Library) [github.com/OSGeo/GDAL](https://github.com/OSGeo/GDAL) * GRASS GIS [github.com/OSGeo/grass](https://github.com/OSGeo/grass) * SAGA GIS [sourceforge.net/projects/saga-gis/](https://sourceforge.net/projects/saga-gis/) * [github.com/jblindsay/whitebox-tools](https://github.com/jblindsay/whitebox-tools) "An advanced geospatial data analysis platform" * [github.com/nst-guide/terrain](https://github.com/nst-guide/terrain) "Generate contours, hillshade, Terrain RGB, slope-angle shading tiles from elevation data." ## License ```txt BSD 3-Clause License Copyright (c) 2024, David Green Redistribution and use in source and binary forms, with or without modification, are permitted provided that the following conditions are met: 1. Redistributions of source code must retain the above copyright notice, this list of conditions and the following disclaimer. 2. Redistributions in binary form must reproduce the above copyright notice, this list of conditions and the following disclaimer in the documentation and/or other materials provided with the distribution. 3. Neither the name of the copyright holder nor the names of its contributors may be used to endorse or promote products derived from this software without specific prior written permission. THIS SOFTWARE IS PROVIDED BY THE COPYRIGHT HOLDERS AND CONTRIBUTORS "AS IS" AND ANY EXPRESS OR IMPLIED WARRANTIES, INCLUDING, BUT NOT LIMITED TO, THE IMPLIED WARRANTIES OF MERCHANTABILITY AND FITNESS FOR A PARTICULAR PURPOSE ARE DISCLAIMED. IN NO EVENT SHALL THE COPYRIGHT HOLDER OR CONTRIBUTORS BE LIABLE FOR ANY DIRECT, INDIRECT, INCIDENTAL, SPECIAL, EXEMPLARY, OR CONSEQUENTIAL DAMAGES (INCLUDING, BUT NOT LIMITED TO, PROCUREMENT OF SUBSTITUTE GOODS OR SERVICES; LOSS OF USE, DATA, OR PROFITS; OR BUSINESS INTERRUPTION) HOWEVER CAUSED AND ON ANY THEORY OF LIABILITY, WHETHER IN CONTRACT, STRICT LIABILITY, OR TORT (INCLUDING NEGLIGENCE OR OTHERWISE) ARISING IN ANY WAY OUT OF THE USE OF THIS SOFTWARE, EVEN IF ADVISED OF THE POSSIBILITY OF SUCH DAMAGE. ``` ## References [^1]: **Horn, B. K. P. (1981)**. "Hill shading and the reflectance map." Proceedings of the IEEE, 69(1), 14-47. https://people.csail.mit.edu/bkph/papers/Hill-Shading.pdf [^2]: "Marching Squares," *Wikipedia*, https://en.wikipedia.org/wiki/Marching_squares [^3]: **Kelso, N. V., & Amos, M. (2016, October 11)**. "Mapzen Terrain Tiles are 1.0 and ready to go." Mapzen. https://mapzen.com/blog/terrain-tile-service [^4]: **Farr, T. G., et al. (2007)**. *The Shuttle Radar Topography Mission.* Reviews of Geophysics, 45(2). DOI: [10.1029/2005RG000183](https://doi.org/10.1029/2005RG000183). [^5]: **Open Geospatial Consortium (OGC)**. "GeoTIFF Standard, Version 1.1." OGC 19-008r4. https://www.ogc.org/standards/geotiff [^6]: **Ramer, U. (1972)**. "An iterative procedure for the polygonal approximation of plane curves." Computer Graphics and Image Processing, 1(3), 244–256. DOI: 10.1016/S0146-664X(72)80017-0 [^7]: **Douglas, D., & Peucker, T. (1973)**. "Algorithms for the reduction of the number of points required to represent a digitized line or its caricature." The Canadian Cartographer, 10(2), 112–122. DOI: 10.3138/FM57-6770-U75U-7727 [^8]: ALOS AW3D30 elevation data provided by the Japan Aerospace Exploration Agency (JAXA), available at 30-meter resolution. Source: JAXA Earth Observation Research Center. https://www.eorc.jaxa.jp/ALOS/en/dataset/aw3d30/aw3d30_e.htm
