KO
|
EN
gitlite — search
Search
#javascript
#python
#hacktoberfest
#react
#ai
#typescript
#llm
#go
#golang
#android
#machine-learning
#rust
#deep-learning
#linux
interactive_plotting
★ 23
Open GitHub ↗
No description available.
Download README (.md)
Explore Similar Repositories
vedaweb-legacy
:
👩🔬 A web-based, open-access platform for linguistic research on old indic texts
go-wx-api
:
微信公众号开发API封装
APT38-DYEPACK
:
Reverse engineered APT38 DYEPACK samples used to empty SWIFT banking servers. Use caution when handling live binaries.
proxyfinder
:
proxyfinder is a simple Go package for finding proxies.
bcomp-extended
:
Emulator of basic computer (ITMO)
// repository documentation
Was this content helpful?
★ 0
(0 ratings)
Select Rating:
★
★
★
★
★
Submit Feedback
Recent Feedback
×
Download README
Do you want to download the
README.md
file for
interactive_plotting
?
Download (.md)
# Interactive Plotting in Scanpy ## About This repository contains 11 different interactive plotting functions, which may be useful during exploratory analysis. Almost every function provides some information when hovering over the plot and some parts of the plots can be hidden by clicking the legend. ## Installation To install this package, do the following: ```bash conda install nodejs # >= v6.10.0, for 3D scatterplot pip install git+https://github.com/theislab/interactive_plotting ``` For 3D scatterplot, `node.js >= v6.10.0` is required. Go to node's [website](https://nodejs.org/en/) for instructions on how to install it. ## Getting Started We recommend checking out the [tutorial notebook](./notebooks/interactive_plotting_tutorial.ipynb). ```ipl.scatter```, ```ipl.scatterc``` ```ipl.dpt``` can handle large number of cells (100K+). In your Jupyter Notebook, execute the following lines: ```python import holoviews as hv # needed for scatter, scatterc and dpt hv.extension('bokeh') import interactive_plotting as ipl from bokeh.io import output_notebook output_notebook() ``` ## Gallery Here are some exemplary figures for each of the plotting functions. ```python ipl.ex.scatter ``` 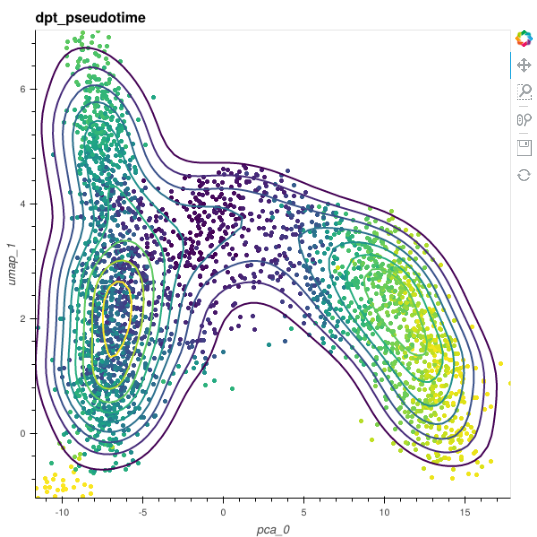 --- ```python ipl.ex.scatter3d ``` 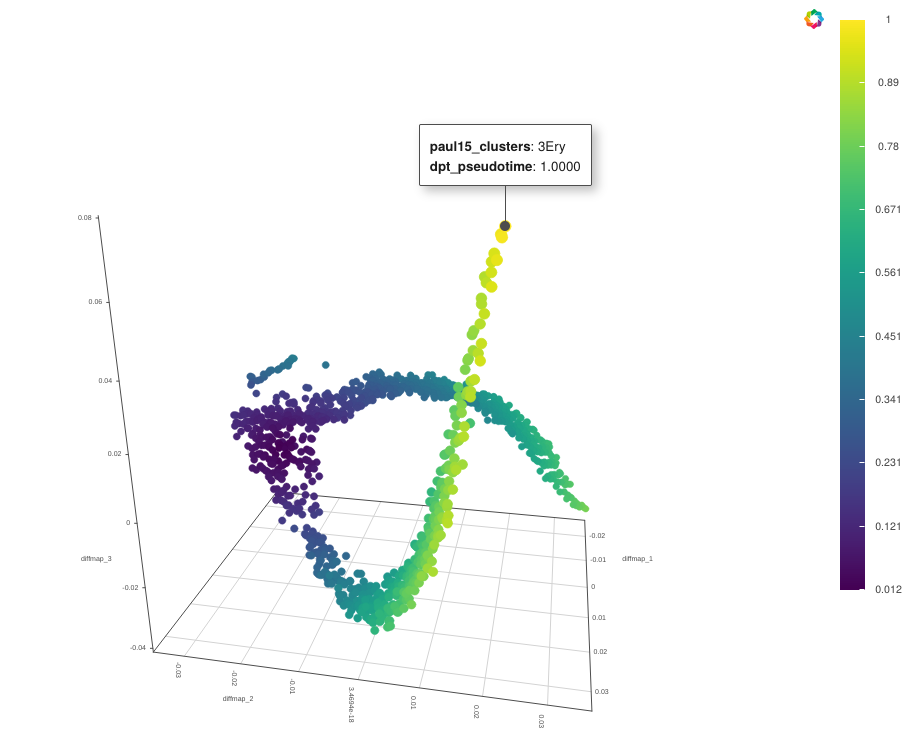 --- ```python ipl.ex.scatter ``` 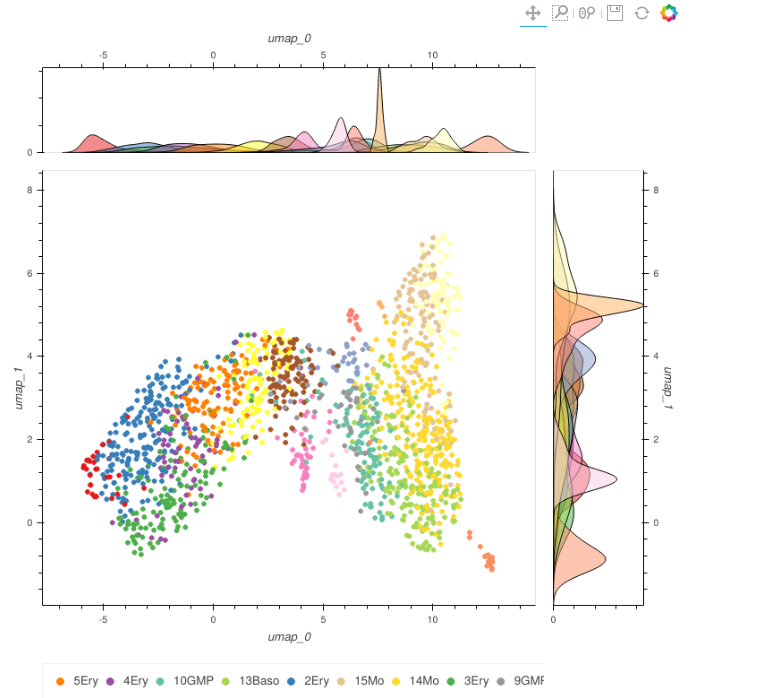 --- ```python ipl.scatter ``` 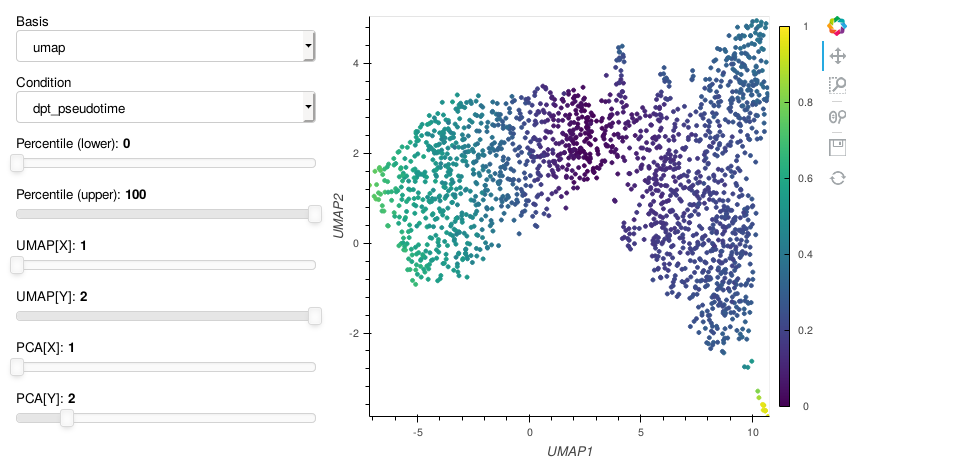") --- ```python ipl.scatterc ``` 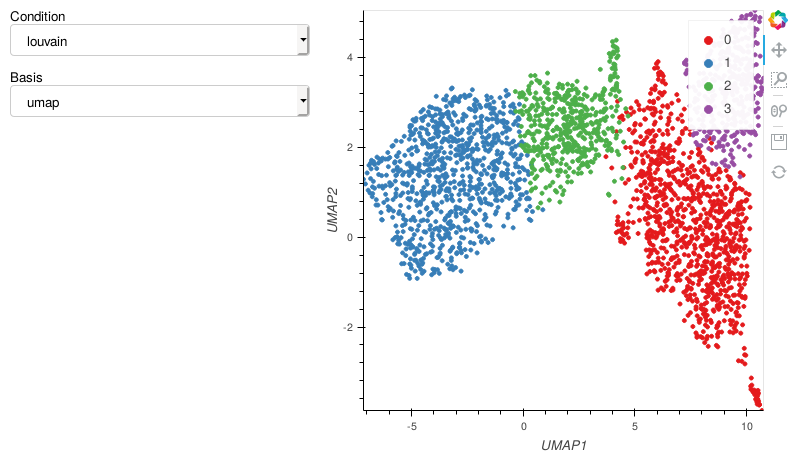") --- ```python ipl.ex.heatmap ``` 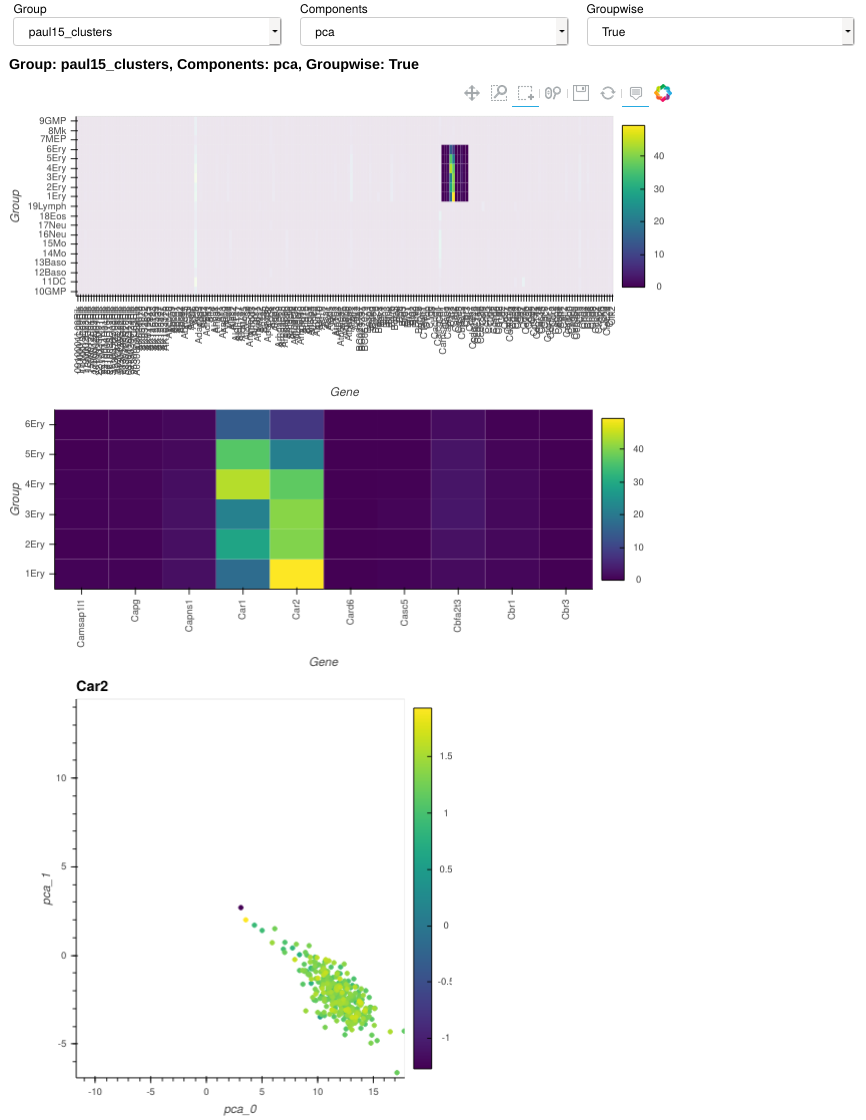 --- ```python ipl.dpt ``` 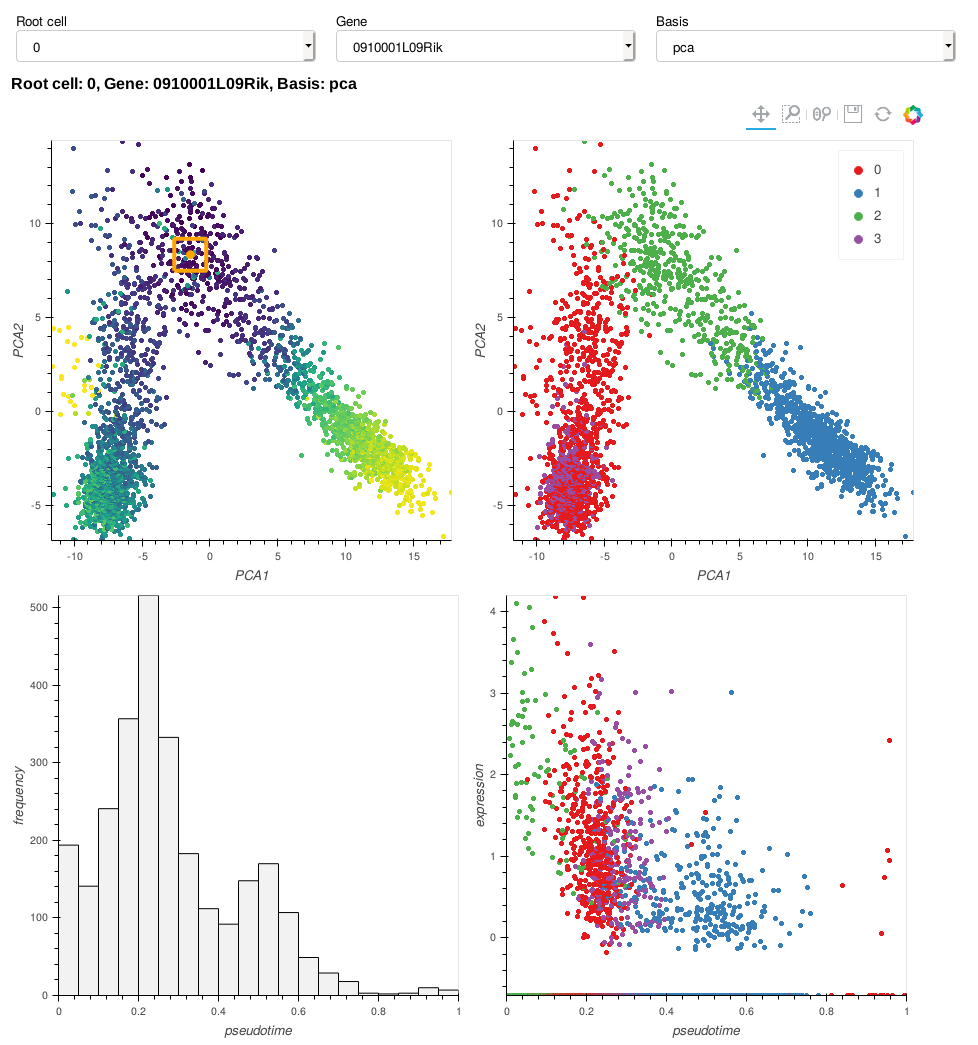 --- ```python ipl.graph ``` 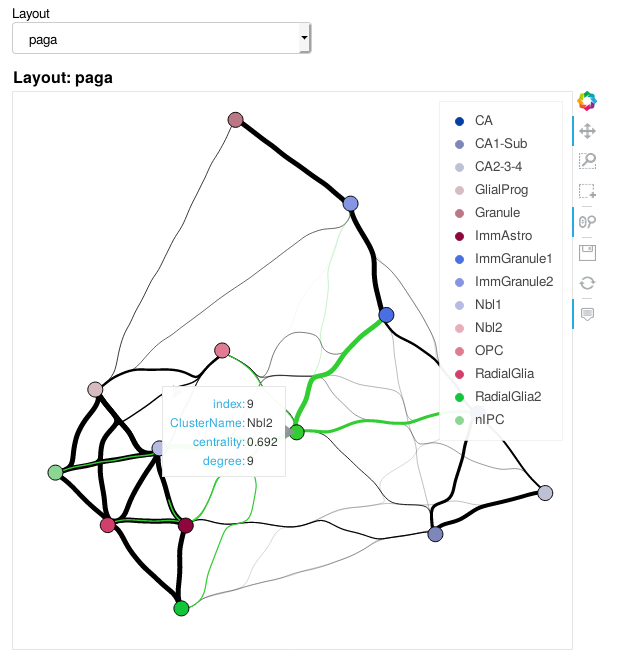 --- ```python ipl.link_plot ``` 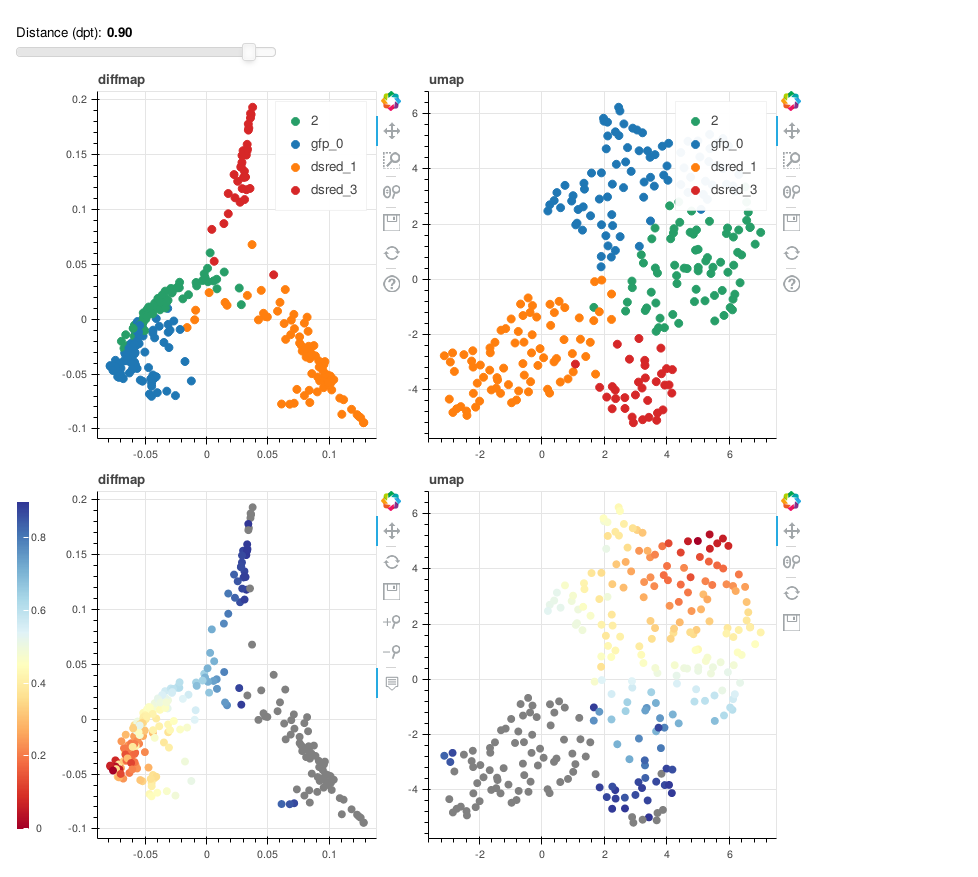 --- ```python ipl.highlight_de ``` 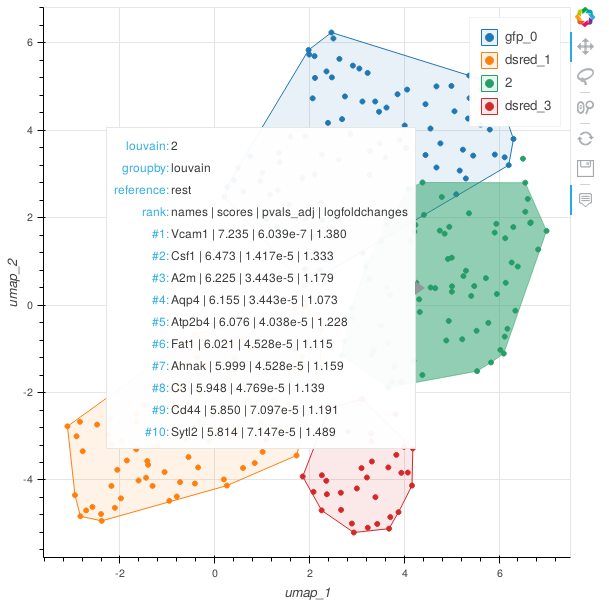 --- ```python ipl.gene_trend ``` 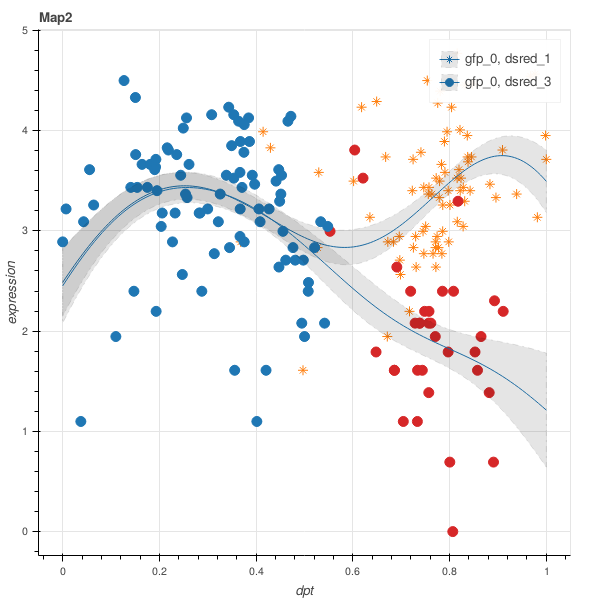 --- ```python ipl.interactive_hist ``` 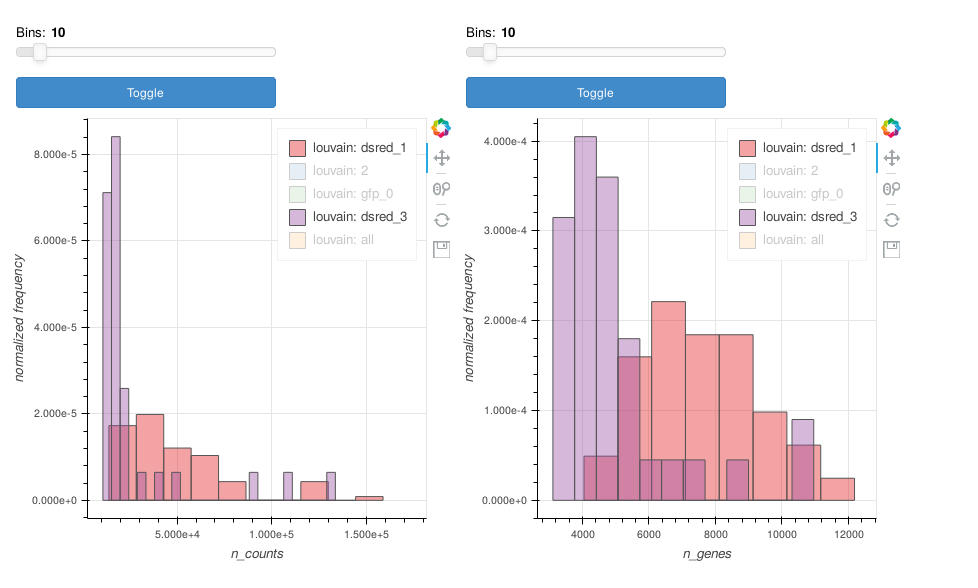 --- ```python ipl.thresholding_hist ``` 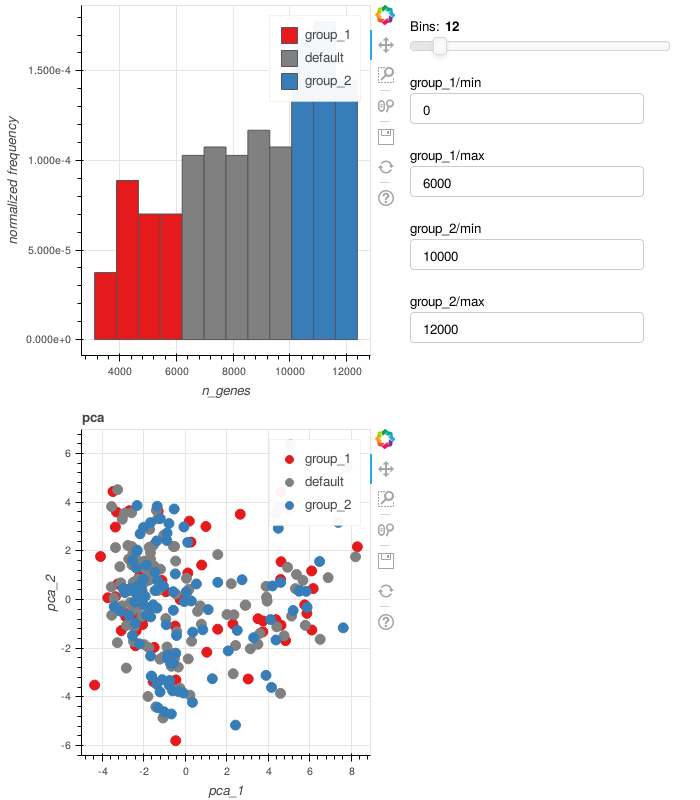 ## Troubleshooting * [Notebook size is **huge**](https://github.com/theislab/interactive_plotting/issues/2) - This has to do with ```ipl.link_plot``` and ```ipl.velocity_plot```. Until a fix is found, we suggest removing these figures after you're done using them. * [Getting "OPub data rate exceeded" error](https://github.com/theislab/interactive_plotting/issues/7) - Try starting jupyter notebook as following: ```jupyter notebook --NotebookApp.iopub_data_rate_limit=1e10``` For generating jupyter config file, see [here](https://stackoverflow.com/questions/43288550/iopub-data-rate-exceeded-in-jupyter-notebook-when-viewing-image).
