KO
|
EN
gitlite — search
Search
#typescript
#ai-agents
#ai
#dsh-plugin
#deepseek-harness
#open-source
#cli
#claude-code
#codex
#developer-tools
#react
#windows
rttcp
★ 33
Open GitHub ↗
No description available.
Download README (.md)
Explore Similar Repositories
GraphQL-Demo
:
用于博文演示GraphQL相关操作
swagger-typescript-fetch-api
:
Swagger codegen for TypeScript Fetch API.
rocksutil
:
A c++ develop toolkit
mtgdeckhunter
:
Uses your Magic the Gathering library to identify decks you can build.
carshopByApp
:
安卓 购物
// repository documentation
Was this content helpful?
★ 0
(0 ratings)
Select Rating:
★
★
★
★
★
Submit Feedback
Recent Feedback
×
Download README
Do you want to download the
README.md
file for
rttcp
?
Download (.md)
# rttcp: A Tool To Debug The Performance of a Network Link Using TCP Copyright 2017 Google Inc. This is not an official Google product. # Introduction rttcp is a tool to analyze the performance of a network link from a packet trace containing TCP traffic. The main use case is to provide some characterization of the performance of a link using a tcp performance test (speedtest). Assume you have a network whose performance you want to debug (e.g. it includes a radio link). You get a client to access a speedtest service (e.g. the [Google Fiber Speedtest](http://speedtest.googlefiber.net/). This is very handy, as any device with a browser can do. You run your HTML speedtest, and get some numbers. You also capture the trace at any point in the path between your device and the speedtest server. While measuring the performance of a connection by using tcp traffic presents some issues (it depends on the exact parameters of tcp, like congestion control, etc.), we can get an idea of how the link is behaving by checking how the packets go back and forth. # 1. Discussion rttcp provides 2 analysis modes, namely "flow" and "packet". 1. the "flow" mode provides a per-flow performance analysis. In particular, it provides 4 graphs: 1. per-flow goodput rate as a function of the timestamp of the first packet in the flow. This is an important statistic, as it shows how the different flows have performed in the experiment. On the other hand, the exact performance depends on multiple factors (the RTT time, the number of losses, etc.), which makes the signal noisy. 2. per-flow median packet RTT as a function of the timestamp of the first packet in the flow. This is the most interesting signal, as discussed in the [example analysis](./example.analysis.md). 3. per-flow total goodput as a function of the timestamp of the first packet in the flow. This is a description of the test setup, for validation purposes. 4. per-flow extra IP traffic as a function of the timestamp of the first packet in the flow. This is a rough validation that there have not been too many losses. 2. the "packet" mode provides an analysis of per-packet RTT data. We measure a TCP segment RTT as the difference between the timestamp of the TCP segment, and the timestamp of the first ACK packet that ACKs the highest SEQ number of the TCP segment. The idea is that the first ACK that acknowledges a full segment is the first instant where we can be sure that the segment has been received. We remove any duplicate data segments to avoid biasing the statistics with the latency of lost packets. This mode, in fact, measures the time for (a) the (data) segment to reach the receiver, (b) the time for the receiver tcp stack to receive it and generate an ACK, and (c) the time for the (pure) ACK to reach the capturing point. This provides a nice measurement of the round-trip time performance of the download path from the capturing point. In particular, the "packet" mode provides 4 graphs (also known as "deltas"): 1. delta1: delta1 is the RTT of every TCP segment in the trace, as a function of the timestamp of the TCP segment. 2. delta2: delta2 is similar to delta1, but instead of using the ACK and SEQ numbers, it uses the TSval and TSecr of the [tcp timestamp option](http://www.ietf.org/rfc/rfc1323.txt). 3. delta3: delta3 tries to calculate the one-way latency of traffic by estimating the offset and HZ of the sender. 4. delta4: delta4 measures the inter-packet latency in tcp trains. It defines a train as a set of packets separated no more than a constant (we use 2 msec for this, as this is the `hystart_ack_delta` constant in `linux/net/ipv4/tcp_cubic.c`). ``` delta1/delta2 data segments /---------------------| - - - - - - - - - - - -\ | | ^ +---------|--+ +---------------+ +--|--------+ | client +| |------------| capture point |-------------| | server | +--------||--| +---------------+ +--|--------+ || | pure ACKs ^ \\---------------------| - - - - - - - - - - - -/ \-------------------->| - - - - - - - - - - - -/ delta3 ``` Figure 1 shows a depiction of 3 of the 4 deltas in the forward case. delta1 and delta2 both measure the time for a segment to go from the capture point to the client and back. delta3 measures the time from the client to the capture point. As the data segments can flow in both directions, we provide for separation of the forward and reverse paths, which are typically different. We also provide a boxplot of the distribution of the values, plus the basic statistics. # 2. Operation 0. `rttcp.py` is a vanilla python file. It uses [tshark](https://www.wireshark.org/docs/wsug_html_chunked/AppToolstshark.html) (a CLI version of wireshark) to print some selected fields in the packet trace. It then uses a combination of numpy, pandas, and matplotlib to analyze and graph the results. To get to know the options of the tool, run: ```shell $ ./rttcp.py help usage: rttcp.py [-h] [-d] [--quiet] [-v] [--tshark TSHARK] [-i INPUT-FILE] [-o OUTPUT-FILE] [--type ANALYSIS_TYPE] [--src-reverse SRC-REVERSE] {help,analyze,plot} ... rttcp flow aggregator. positional arguments: {help,analyze,plot} help show help screen analyze analyze pcap file plot plot analysis file optional arguments: -h, --help show this help message and exit -d, --debug Increase verbosity (use multiple times for more) --quiet Zero verbosity -v, --version show program's version number and exit --tshark TSHARK tshark binary -i INPUT-FILE, --input INPUT-FILE input file -o OUTPUT-FILE, --output OUTPUT-FILE output file --type ANALYSIS_TYPE set the analysis type (flow, packet) --src-reverse SRC-REVERSE any packet from a src definition (cidr) as reverse ``` 1. To run the "flow" analysis: ```shell $ ./rttcp.py analyze --type "flow" -i trace.pcap -o trace.pcap.flow.txt ... $ ./rttcp.py plot --type "flow" -i trace.pcap.flow.txt --title "flow analysis, trace.fibertest.pcap" --src-reverse 192.168 -o trace.fibertest.pcap.flow.png # plotting /data/chema/proj/marconi-traces/loon/trace.fibertest.pcap.flow.txt $ ./rttcp.py plot --type "flow" -i trace.pcap.flow.txt --title "flow analysis, trace.fibertest.pcap" --src-reverse 192.168 -o trace.fibertest.pcap.flow.pdf ``` 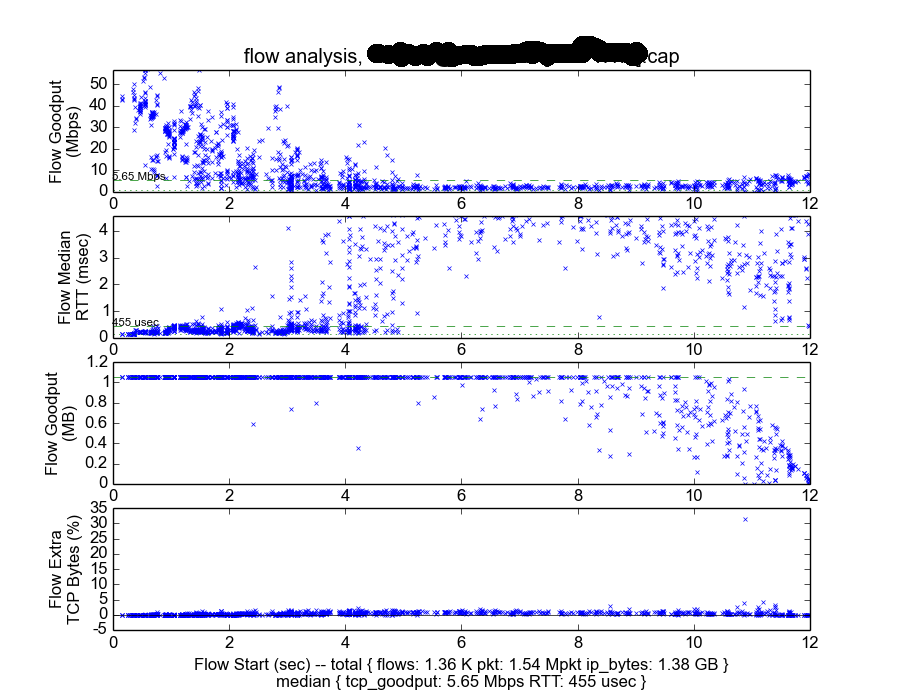 Figure 2 shows an example of "flow" analysis result. 2. To run the "packet" analysis: ```shell $ ./rttcp.py analyze --type "packet" -i trace.pcap -o trace.pcap.packet.txt ... $ ./rttcp.py plot --type "packet" -i trace.pcap.packet.txt --title "packet analysis, trace.fibertest.pcap" --src-reverse 192.168 -o trace.fibertest.pcap.packet.png ``` 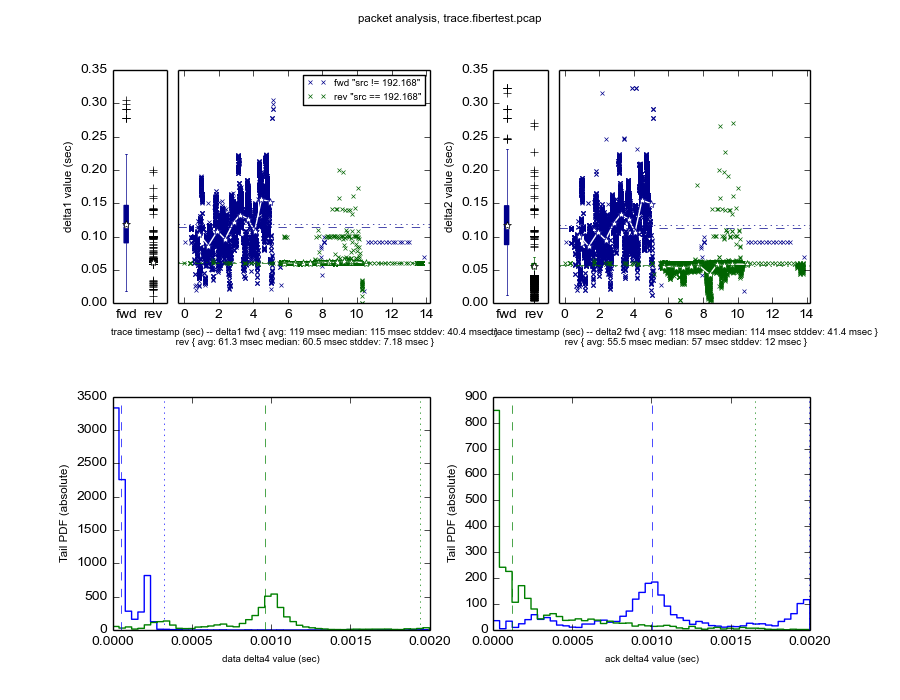 Figure 3 shows an example of "packet" analysis result. # 3. References * [tcptrace](http://www.tcptrace.org/): rttcp is very similar to tcptrace, but oriented to analyzing a trace composed of multiple connections, instead of performing per-connection analysis.
