KO
|
EN
gitlite — search
Search
#javascript
#python
#hacktoberfest
#react
#ai
#typescript
#llm
#go
#golang
#android
#machine-learning
#rust
#deep-learning
#linux
multiweb
★ 19
Open GitHub ↗
Multiple projects for debugging sample.
Download README (.md)
Explore Similar Repositories
8086.js
:
A basic web-based 8086 emulator built with Javascript :rocket:
BTWalk
:
Implementation of TKDE20 paper ''BTWalk: Branching Tree Random Walk for Multi-order Structured Network Embedding''
react-hide-on-scroll
:
A react component library to hide/show elements based on scroll
robot4fund
:
PC端同花顺拖拉机自动申购场内基金
MaplePacketPuller
:
A Python Maplestory Packet Structure Analyzer
// repository documentation
Was this content helpful?
★ 0
(0 ratings)
Select Rating:
★
★
★
★
★
Submit Feedback
Recent Feedback
×
Download README
Do you want to download the
README.md
file for
multiweb
?
Download (.md)
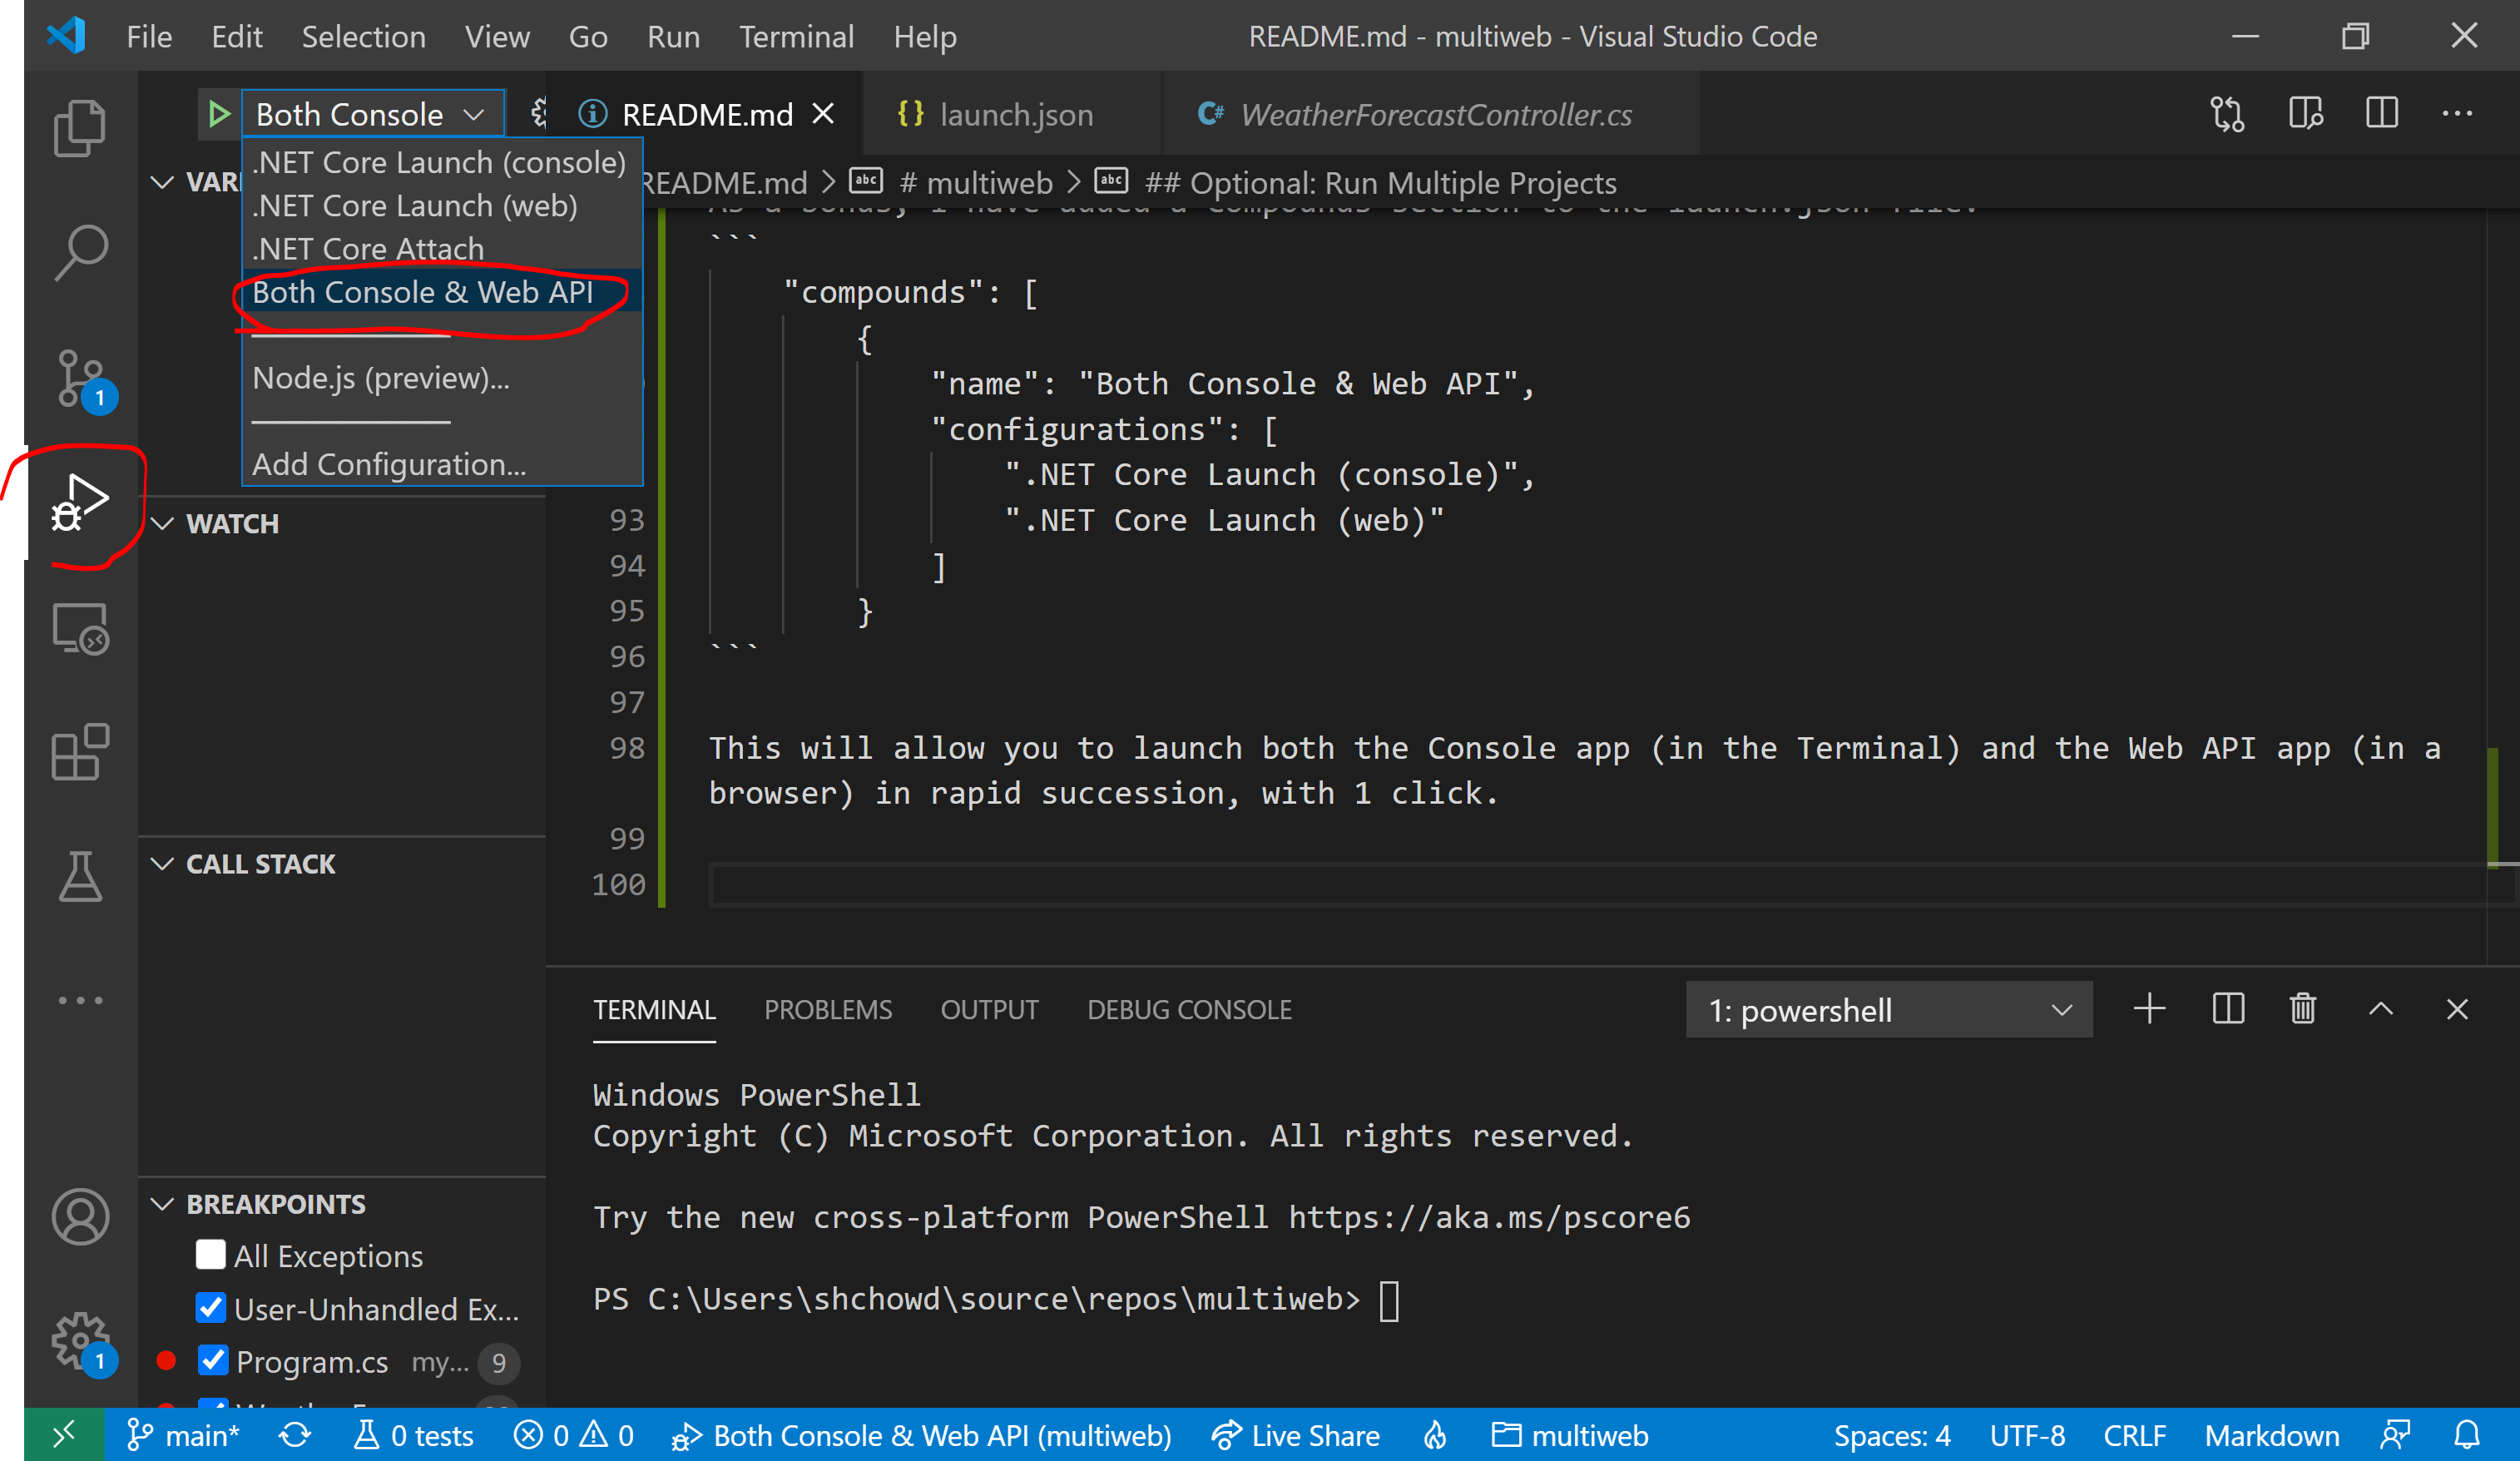
# multiweb Multiple projects for debugging sample. ## Opening VS Code Launch VS Code with the project root as the current working directory. One easy way to do this is to type the word "code" followed by a dot "." at a Command Prompt, Powershell window or Windows Terminal. Powershell/Terminal Command: ``` code . ``` 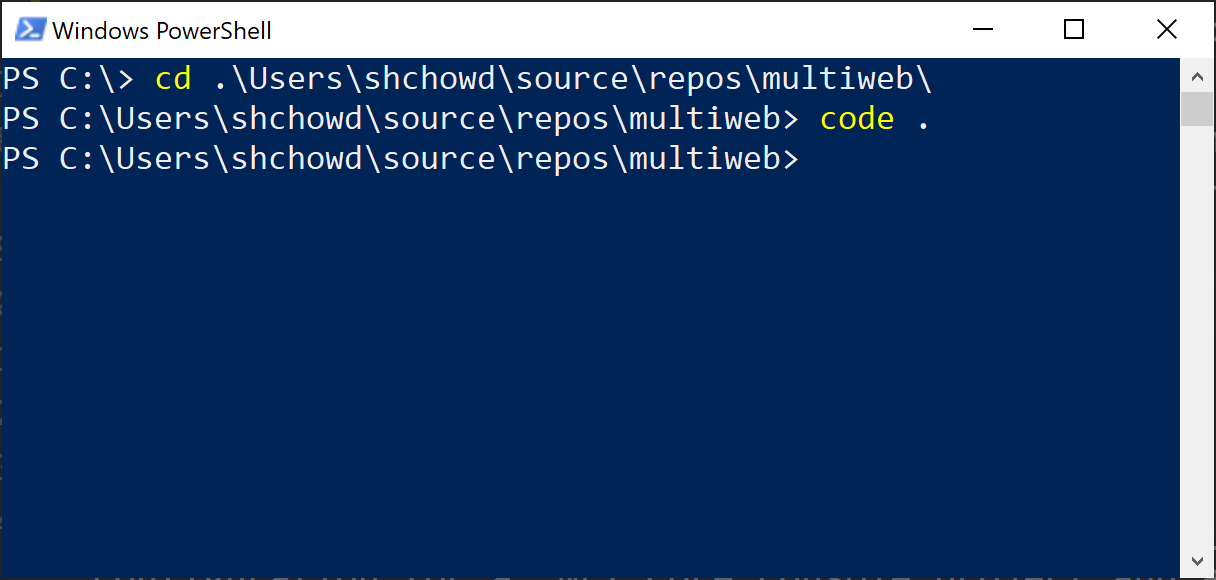 If you already have VS Code open, use the built-in Terminal (Ctrl+`) to change the current directory to the project root. In either case, you should end up with VS Code open with the Terminal open in the correction location (project root). 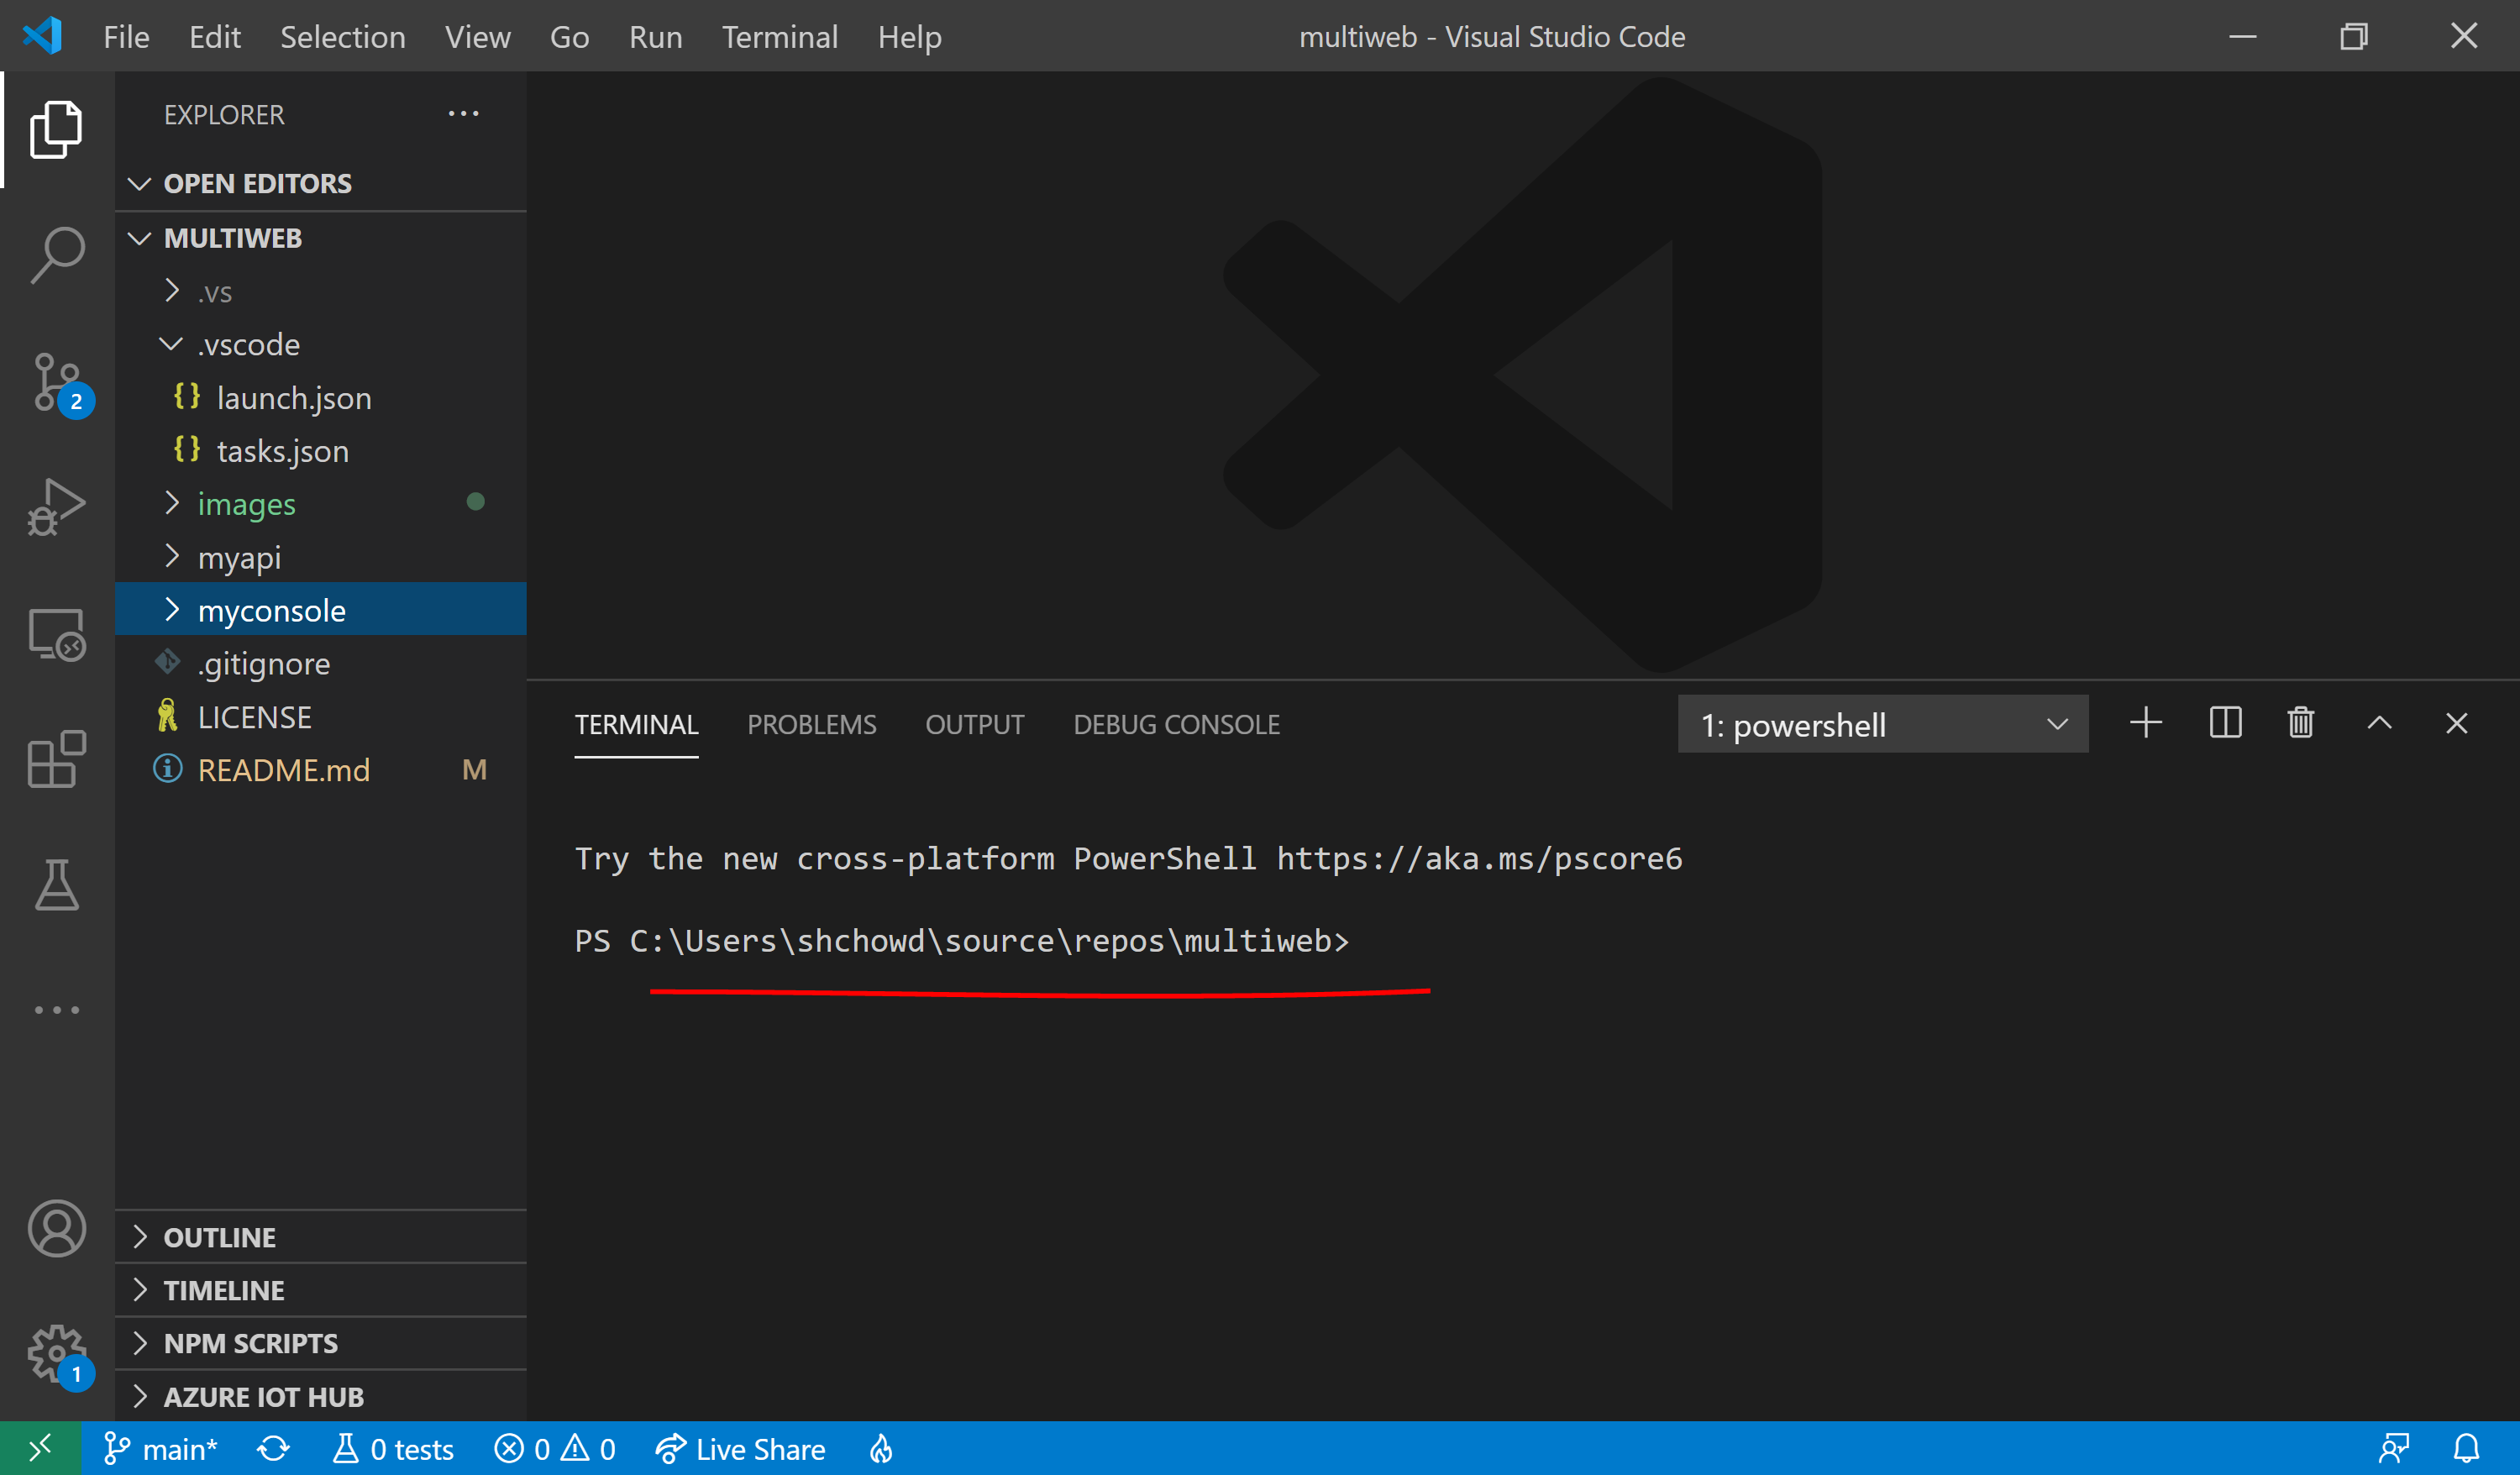 ## Launch Configuration This project contains [launch.json](.vscode/launch.json) configuration for a .NET Core console project and a Web API projet. Web API Launch Configuration: 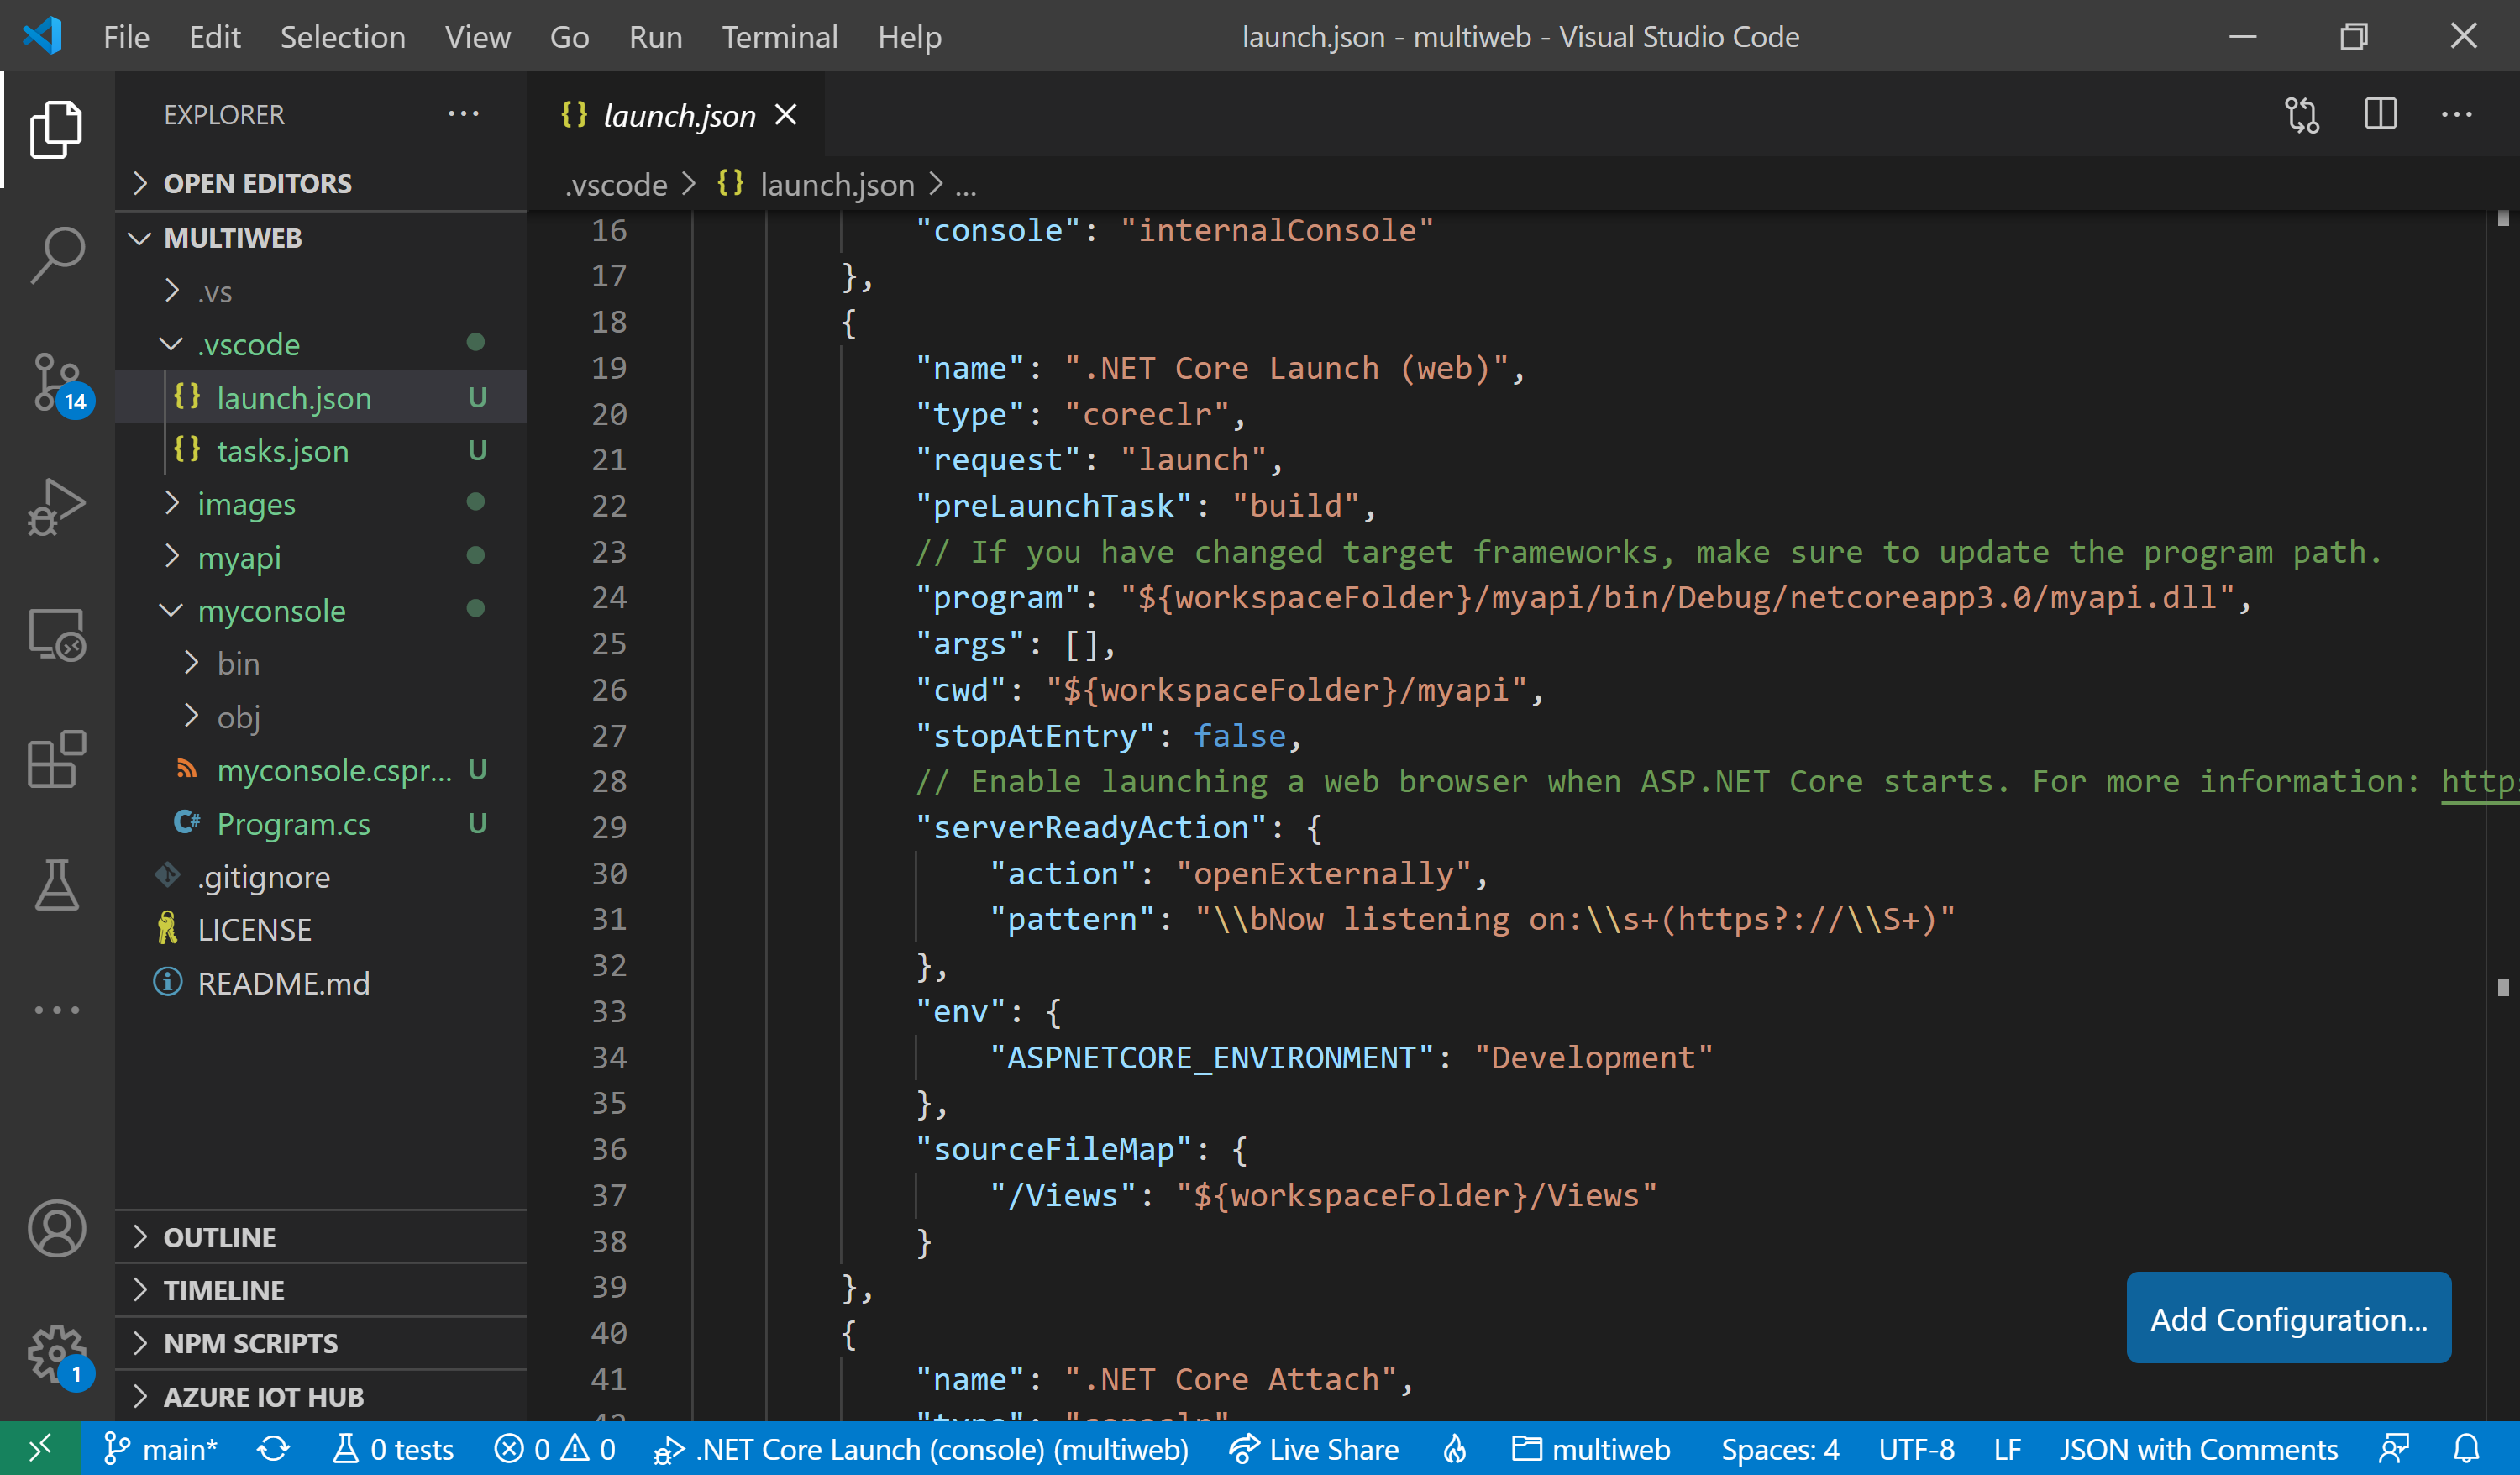 Console Project Launch Configuration: 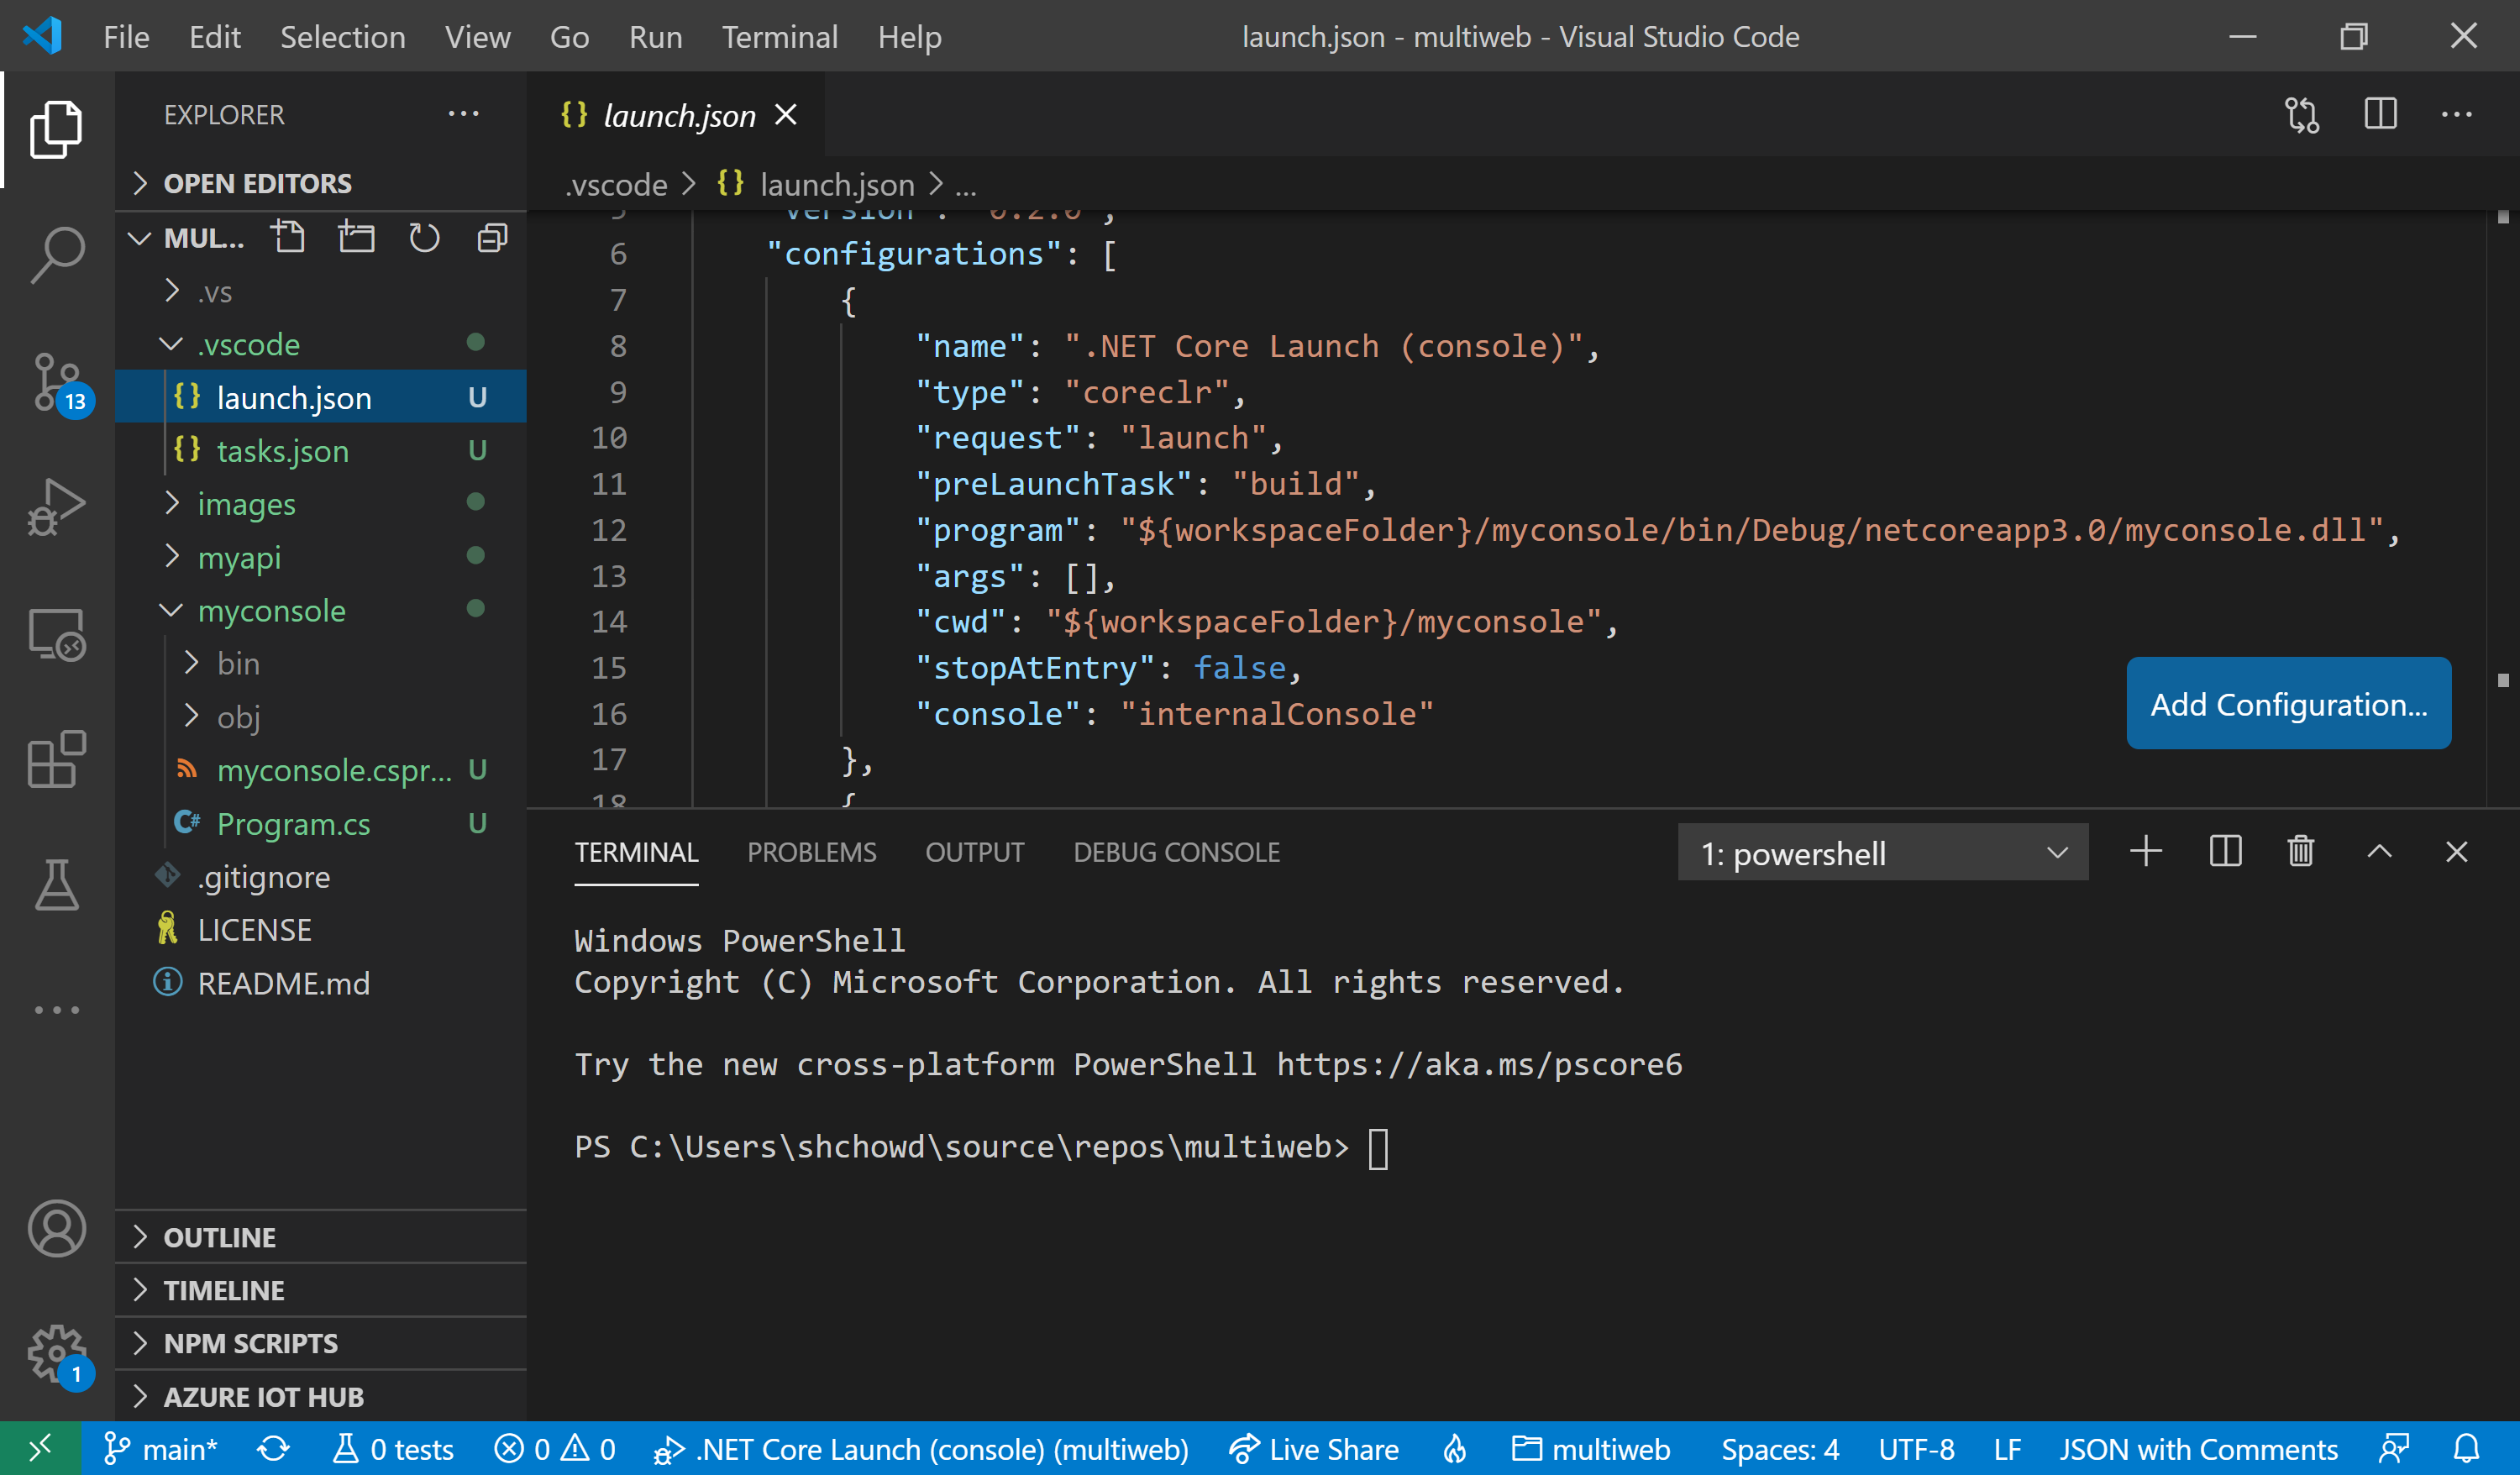 ## Debug Panel In the Debug Panel of VS Code, observe that you can see both configurations, ready for launch. Web API in Debug Panel: 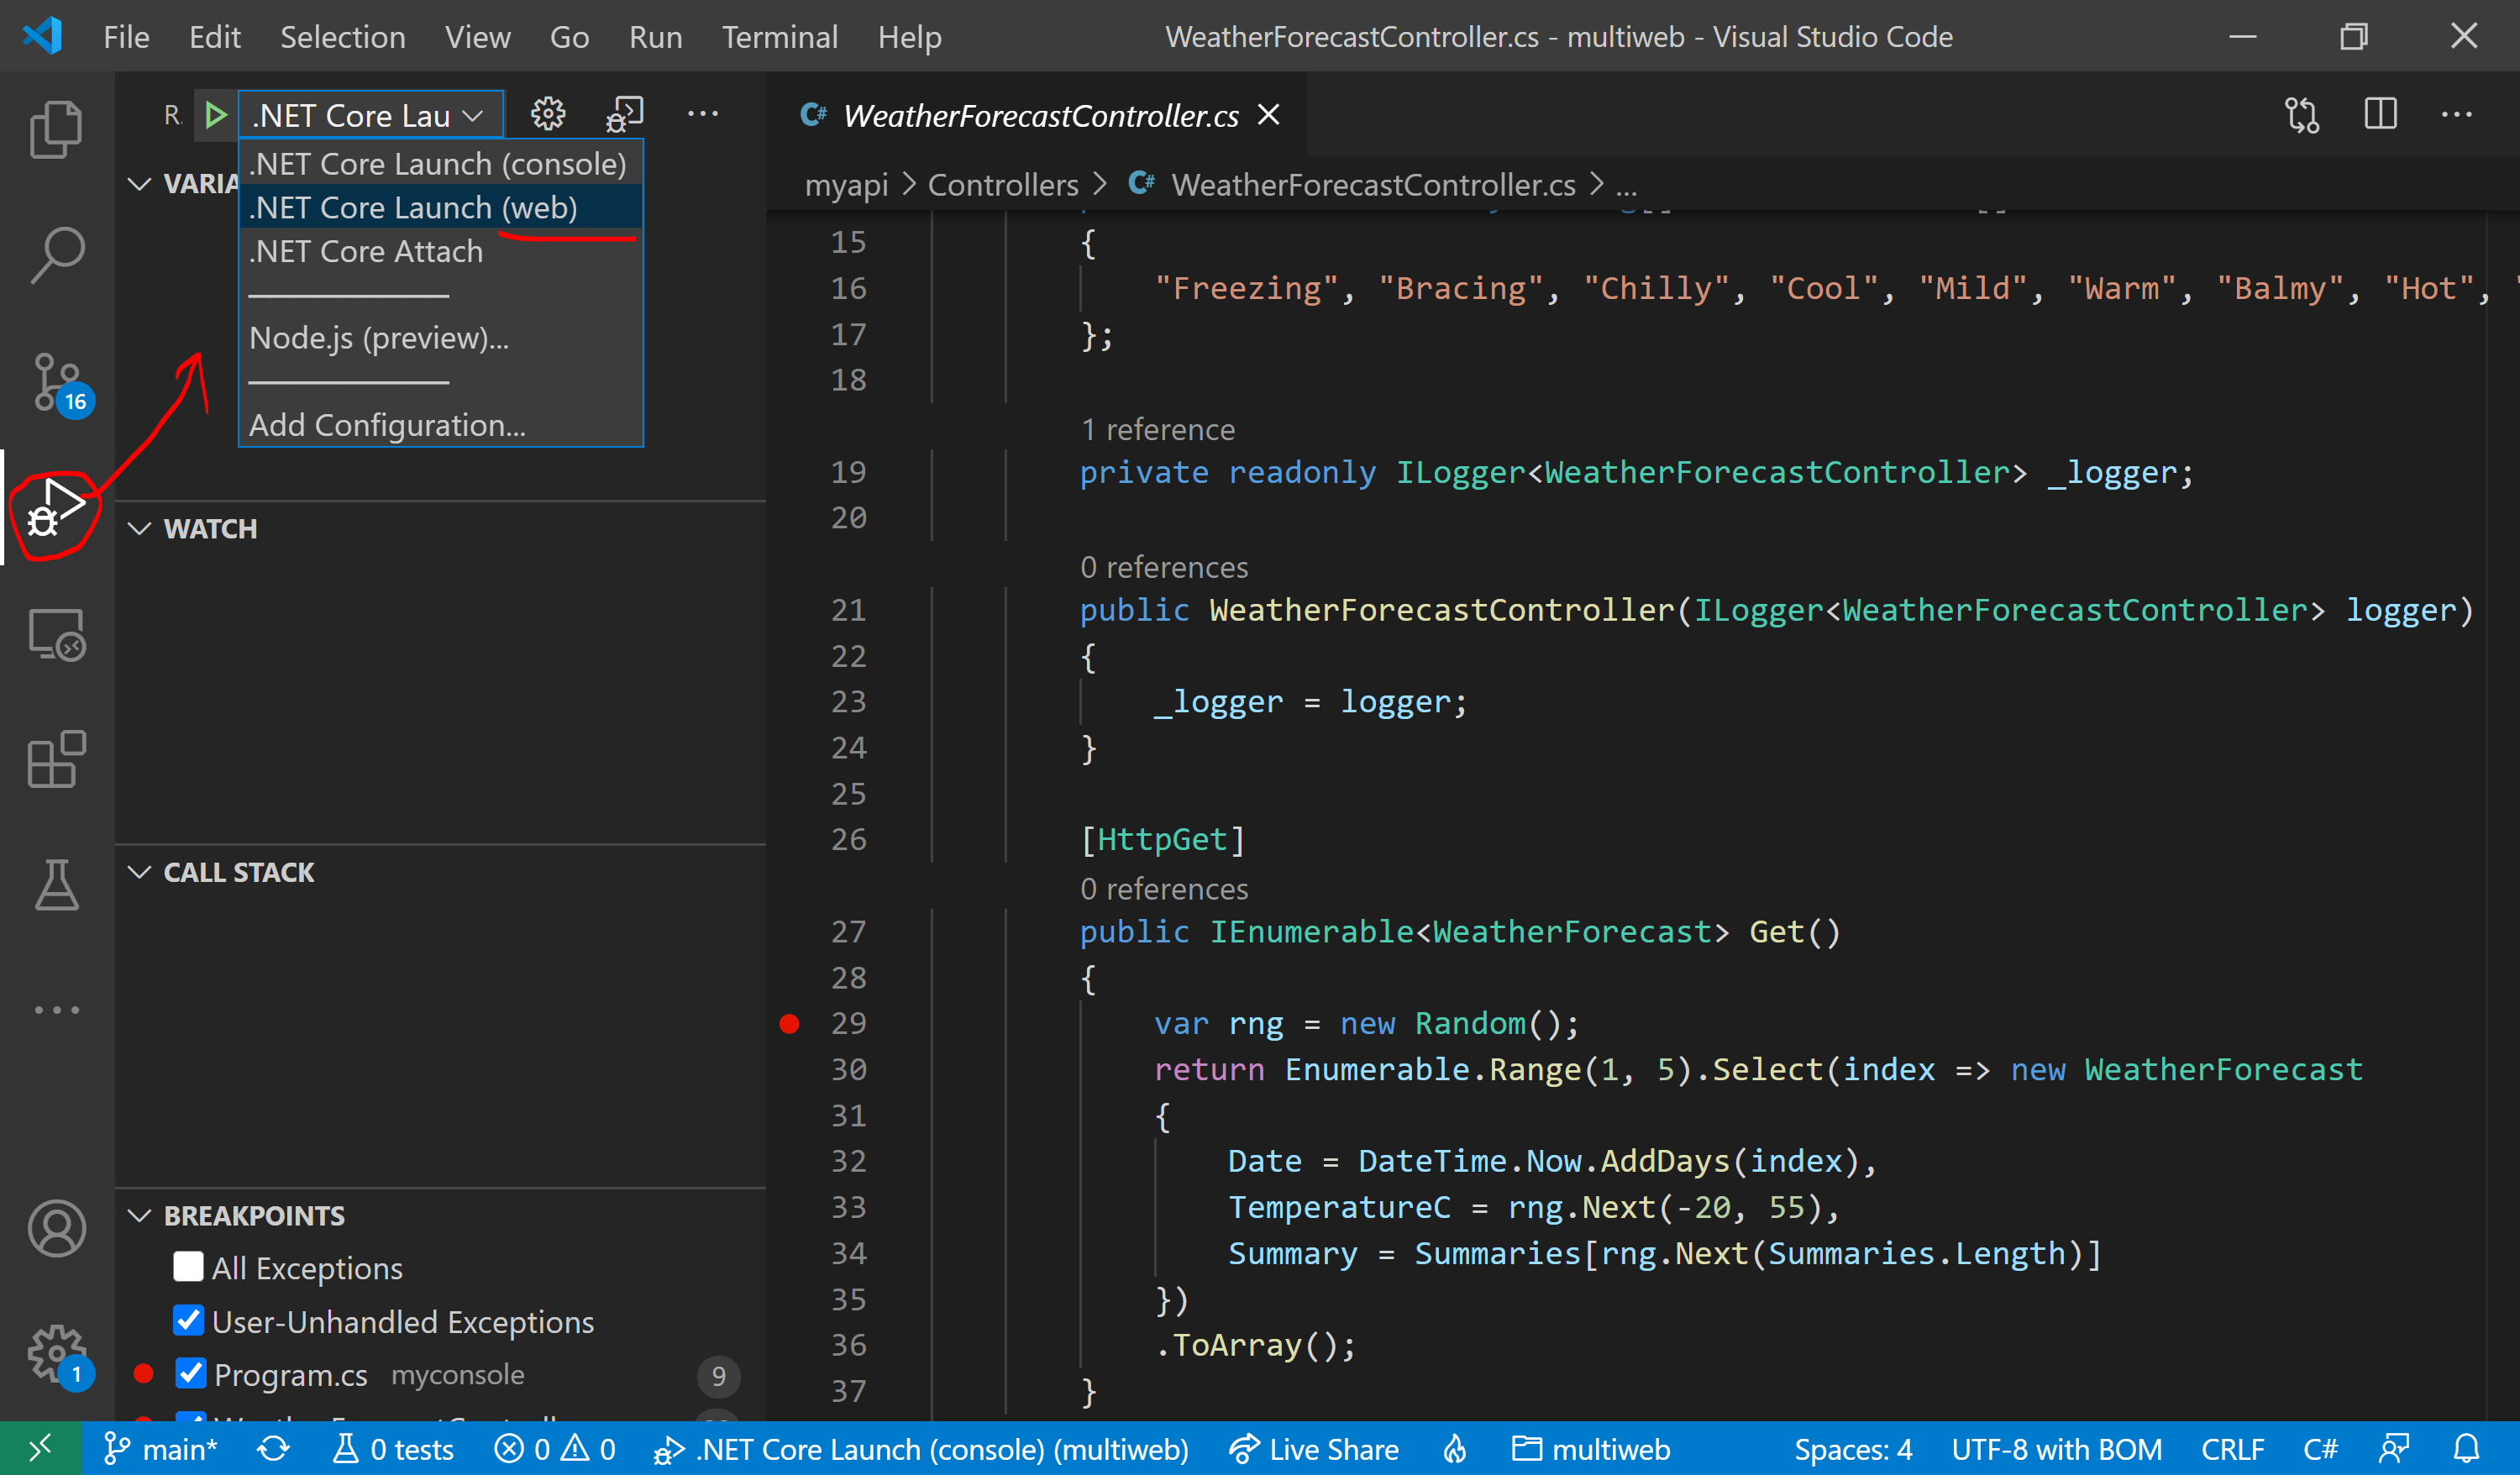 Console Project in Debug Panel: 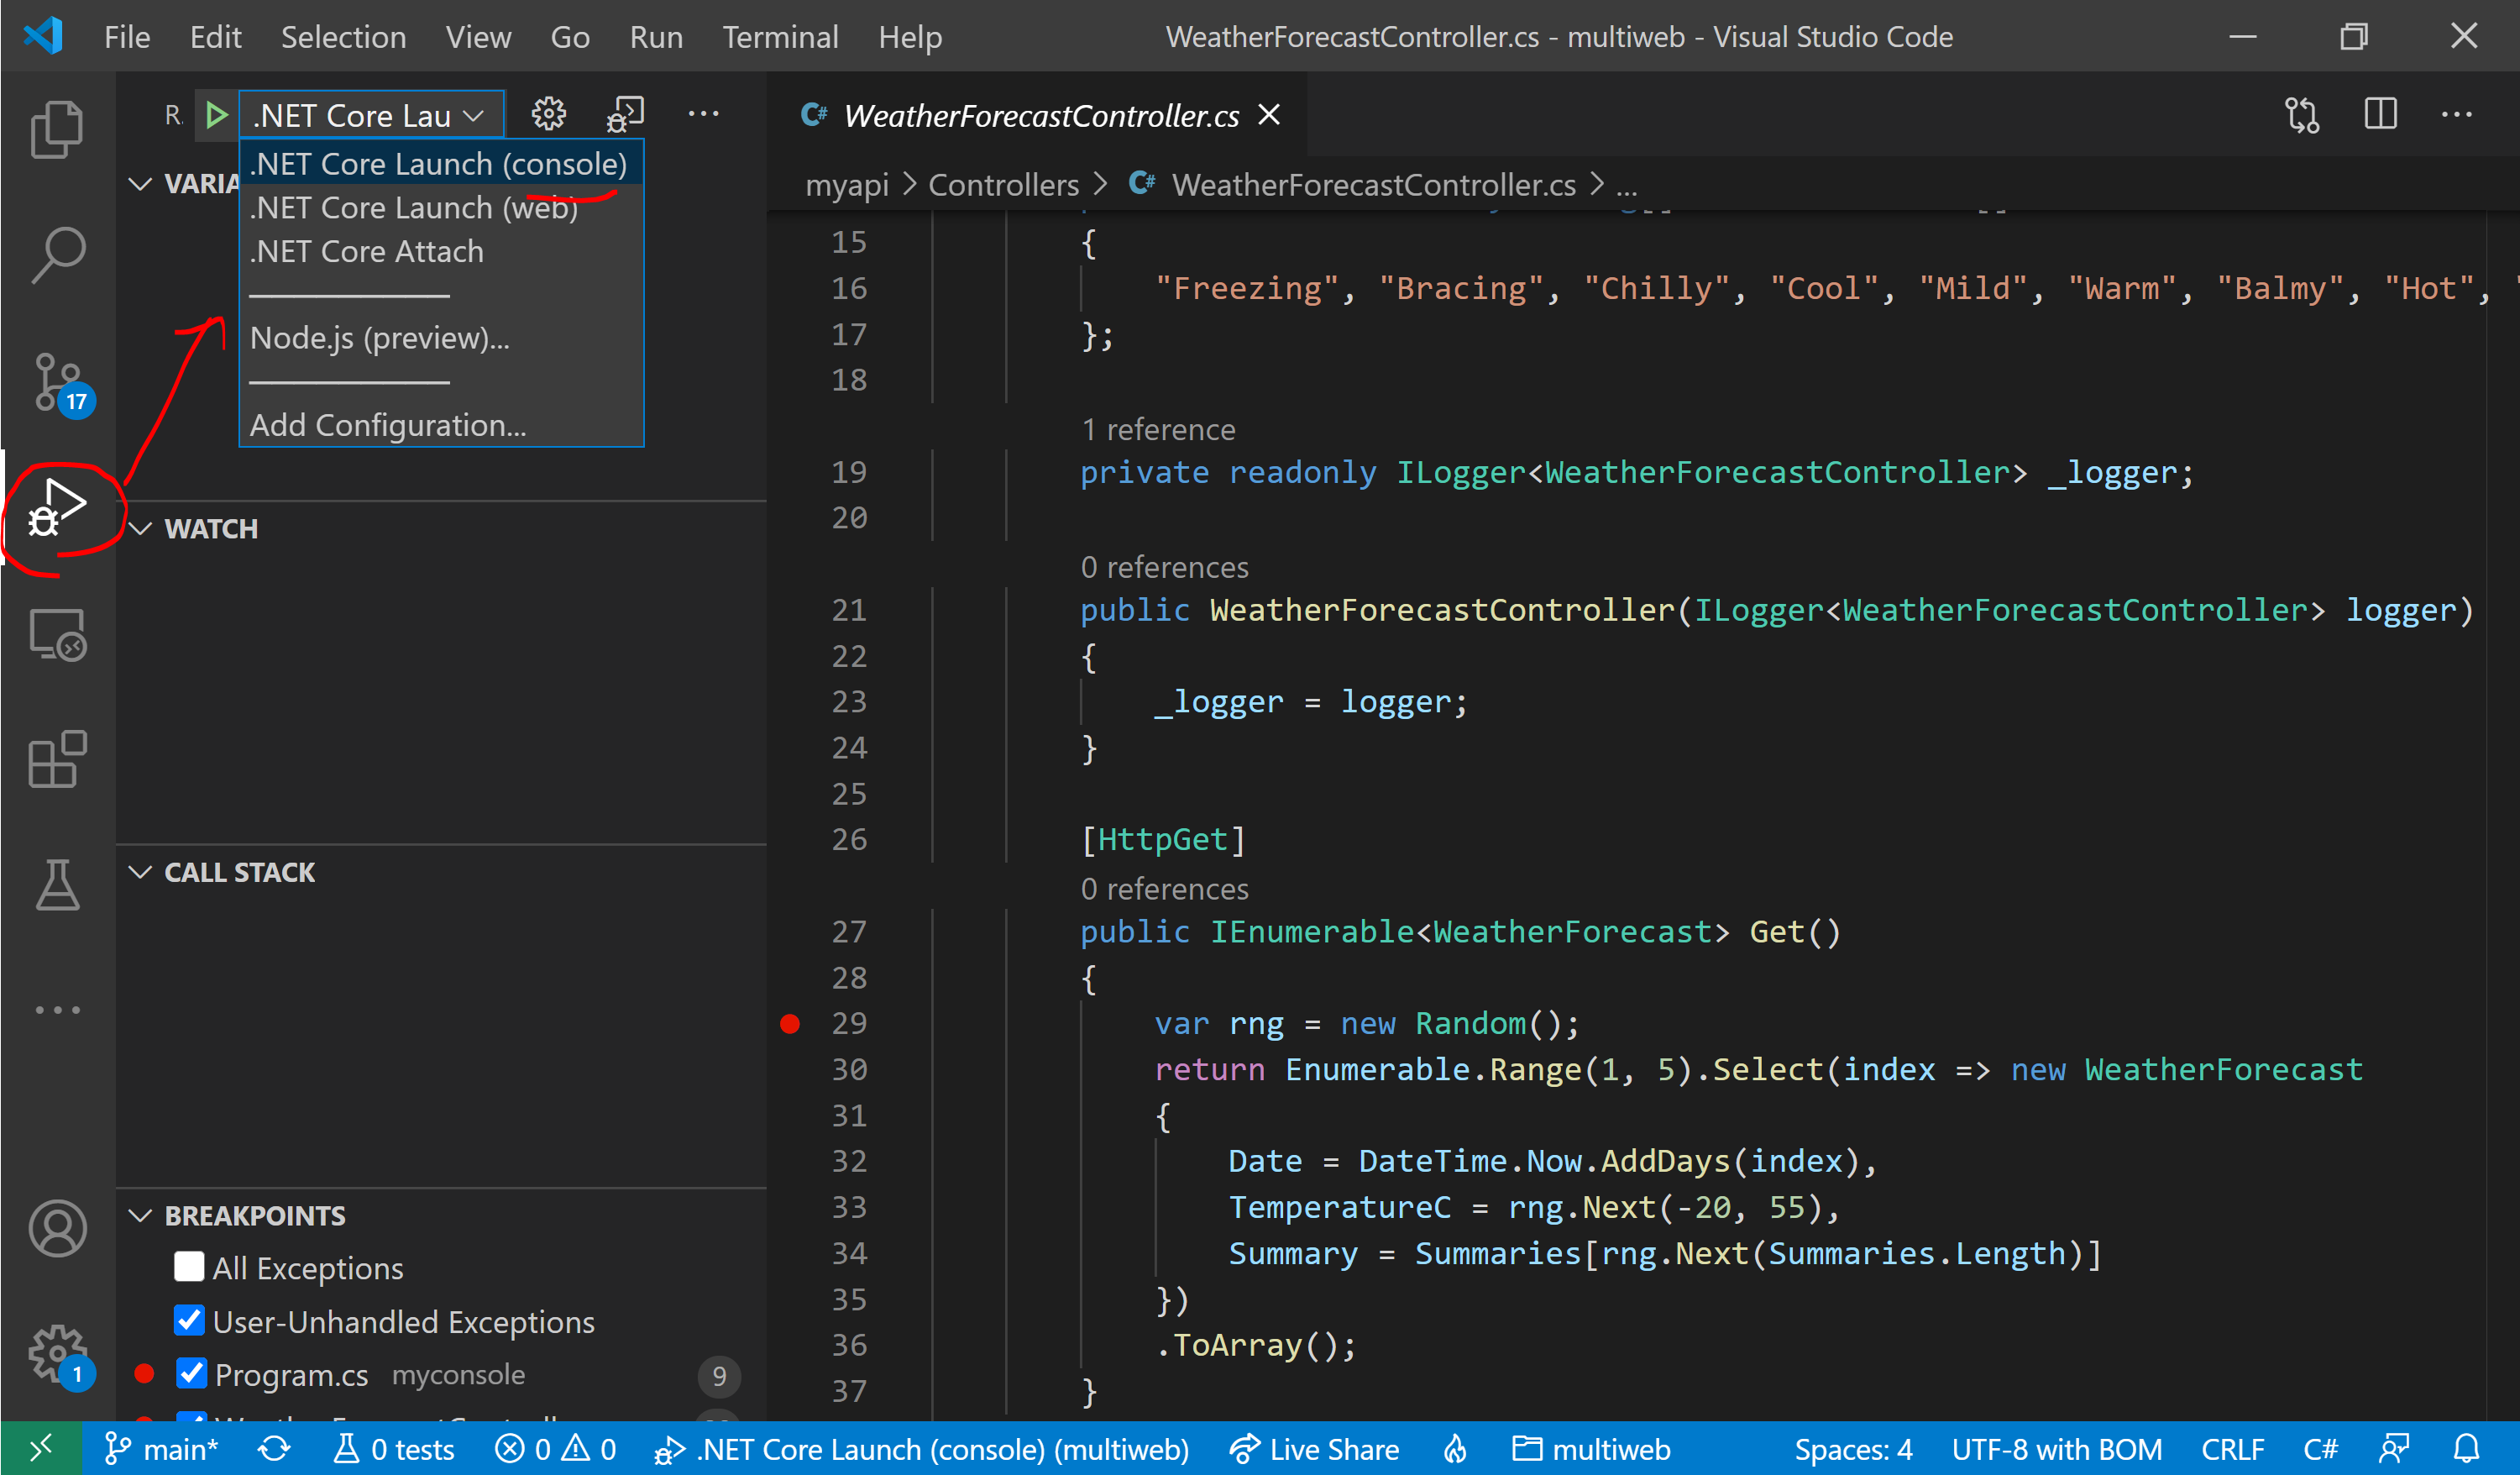 ## Setting Breakpoints In the code for each project, set a breakpoint that's easy to identify. e.g. Inside Get() method within WeatherForecastController.cs in Web API project 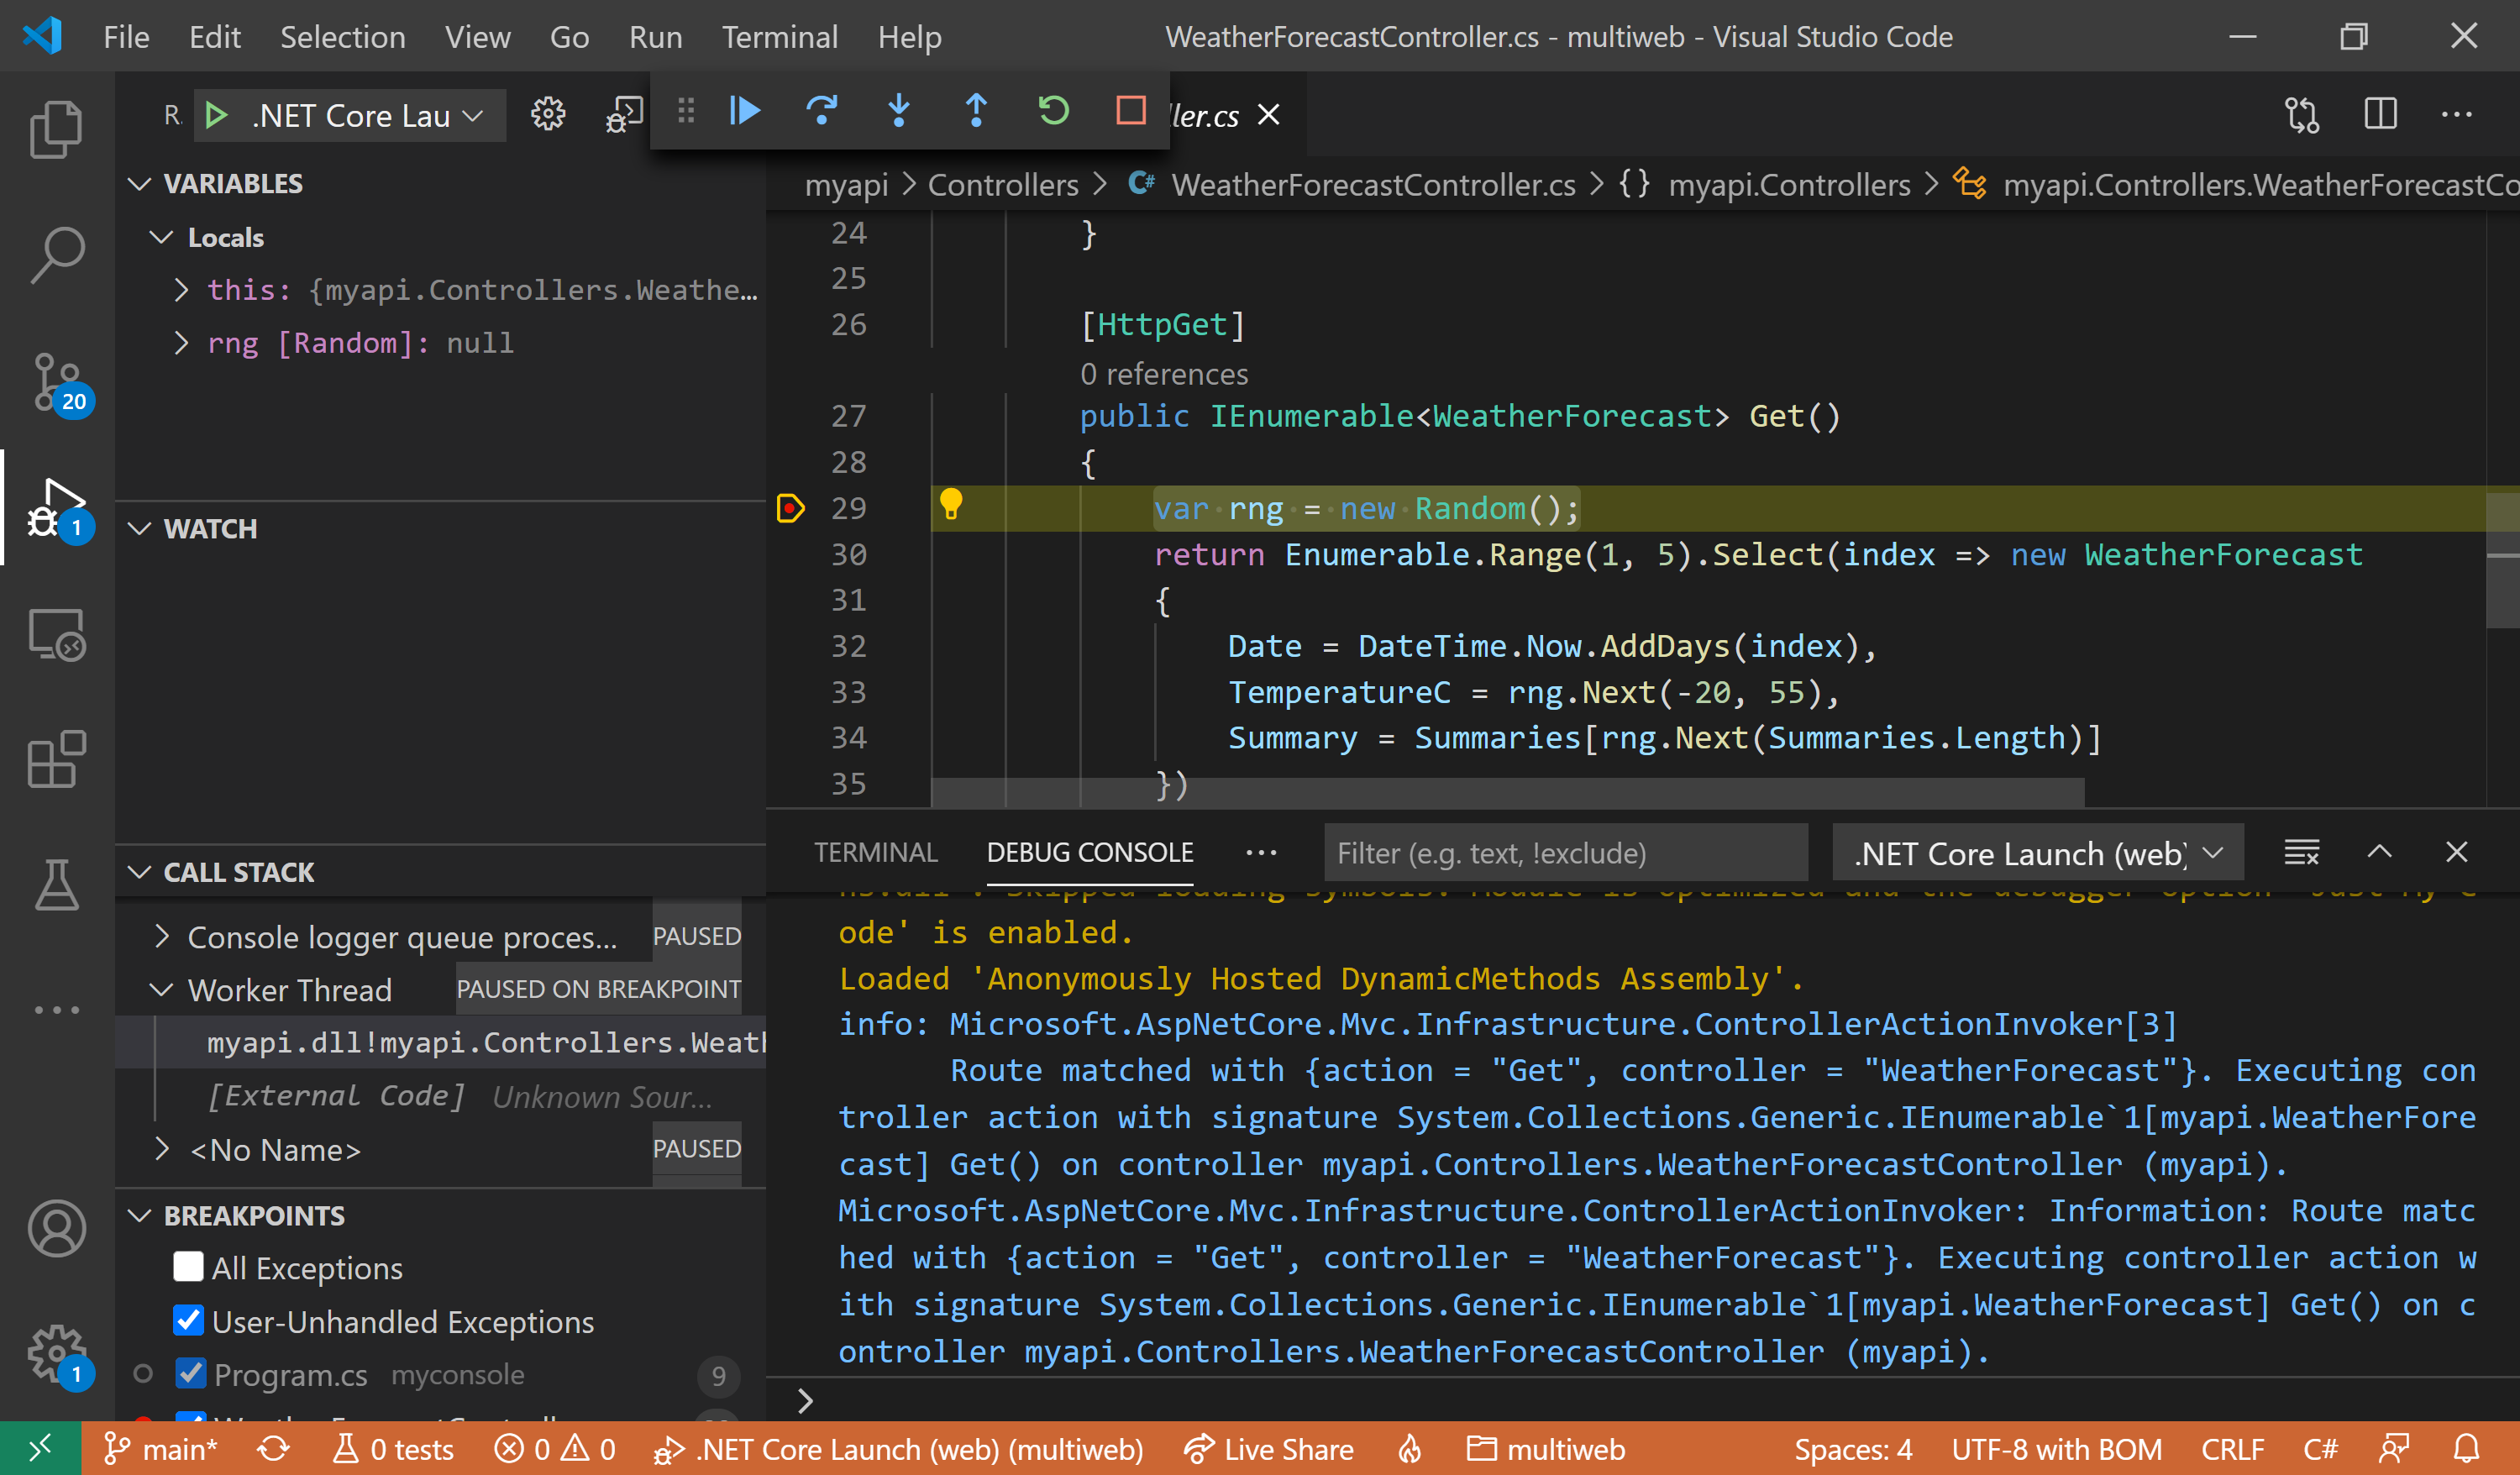 e.g. Console.WriteLine in Console project 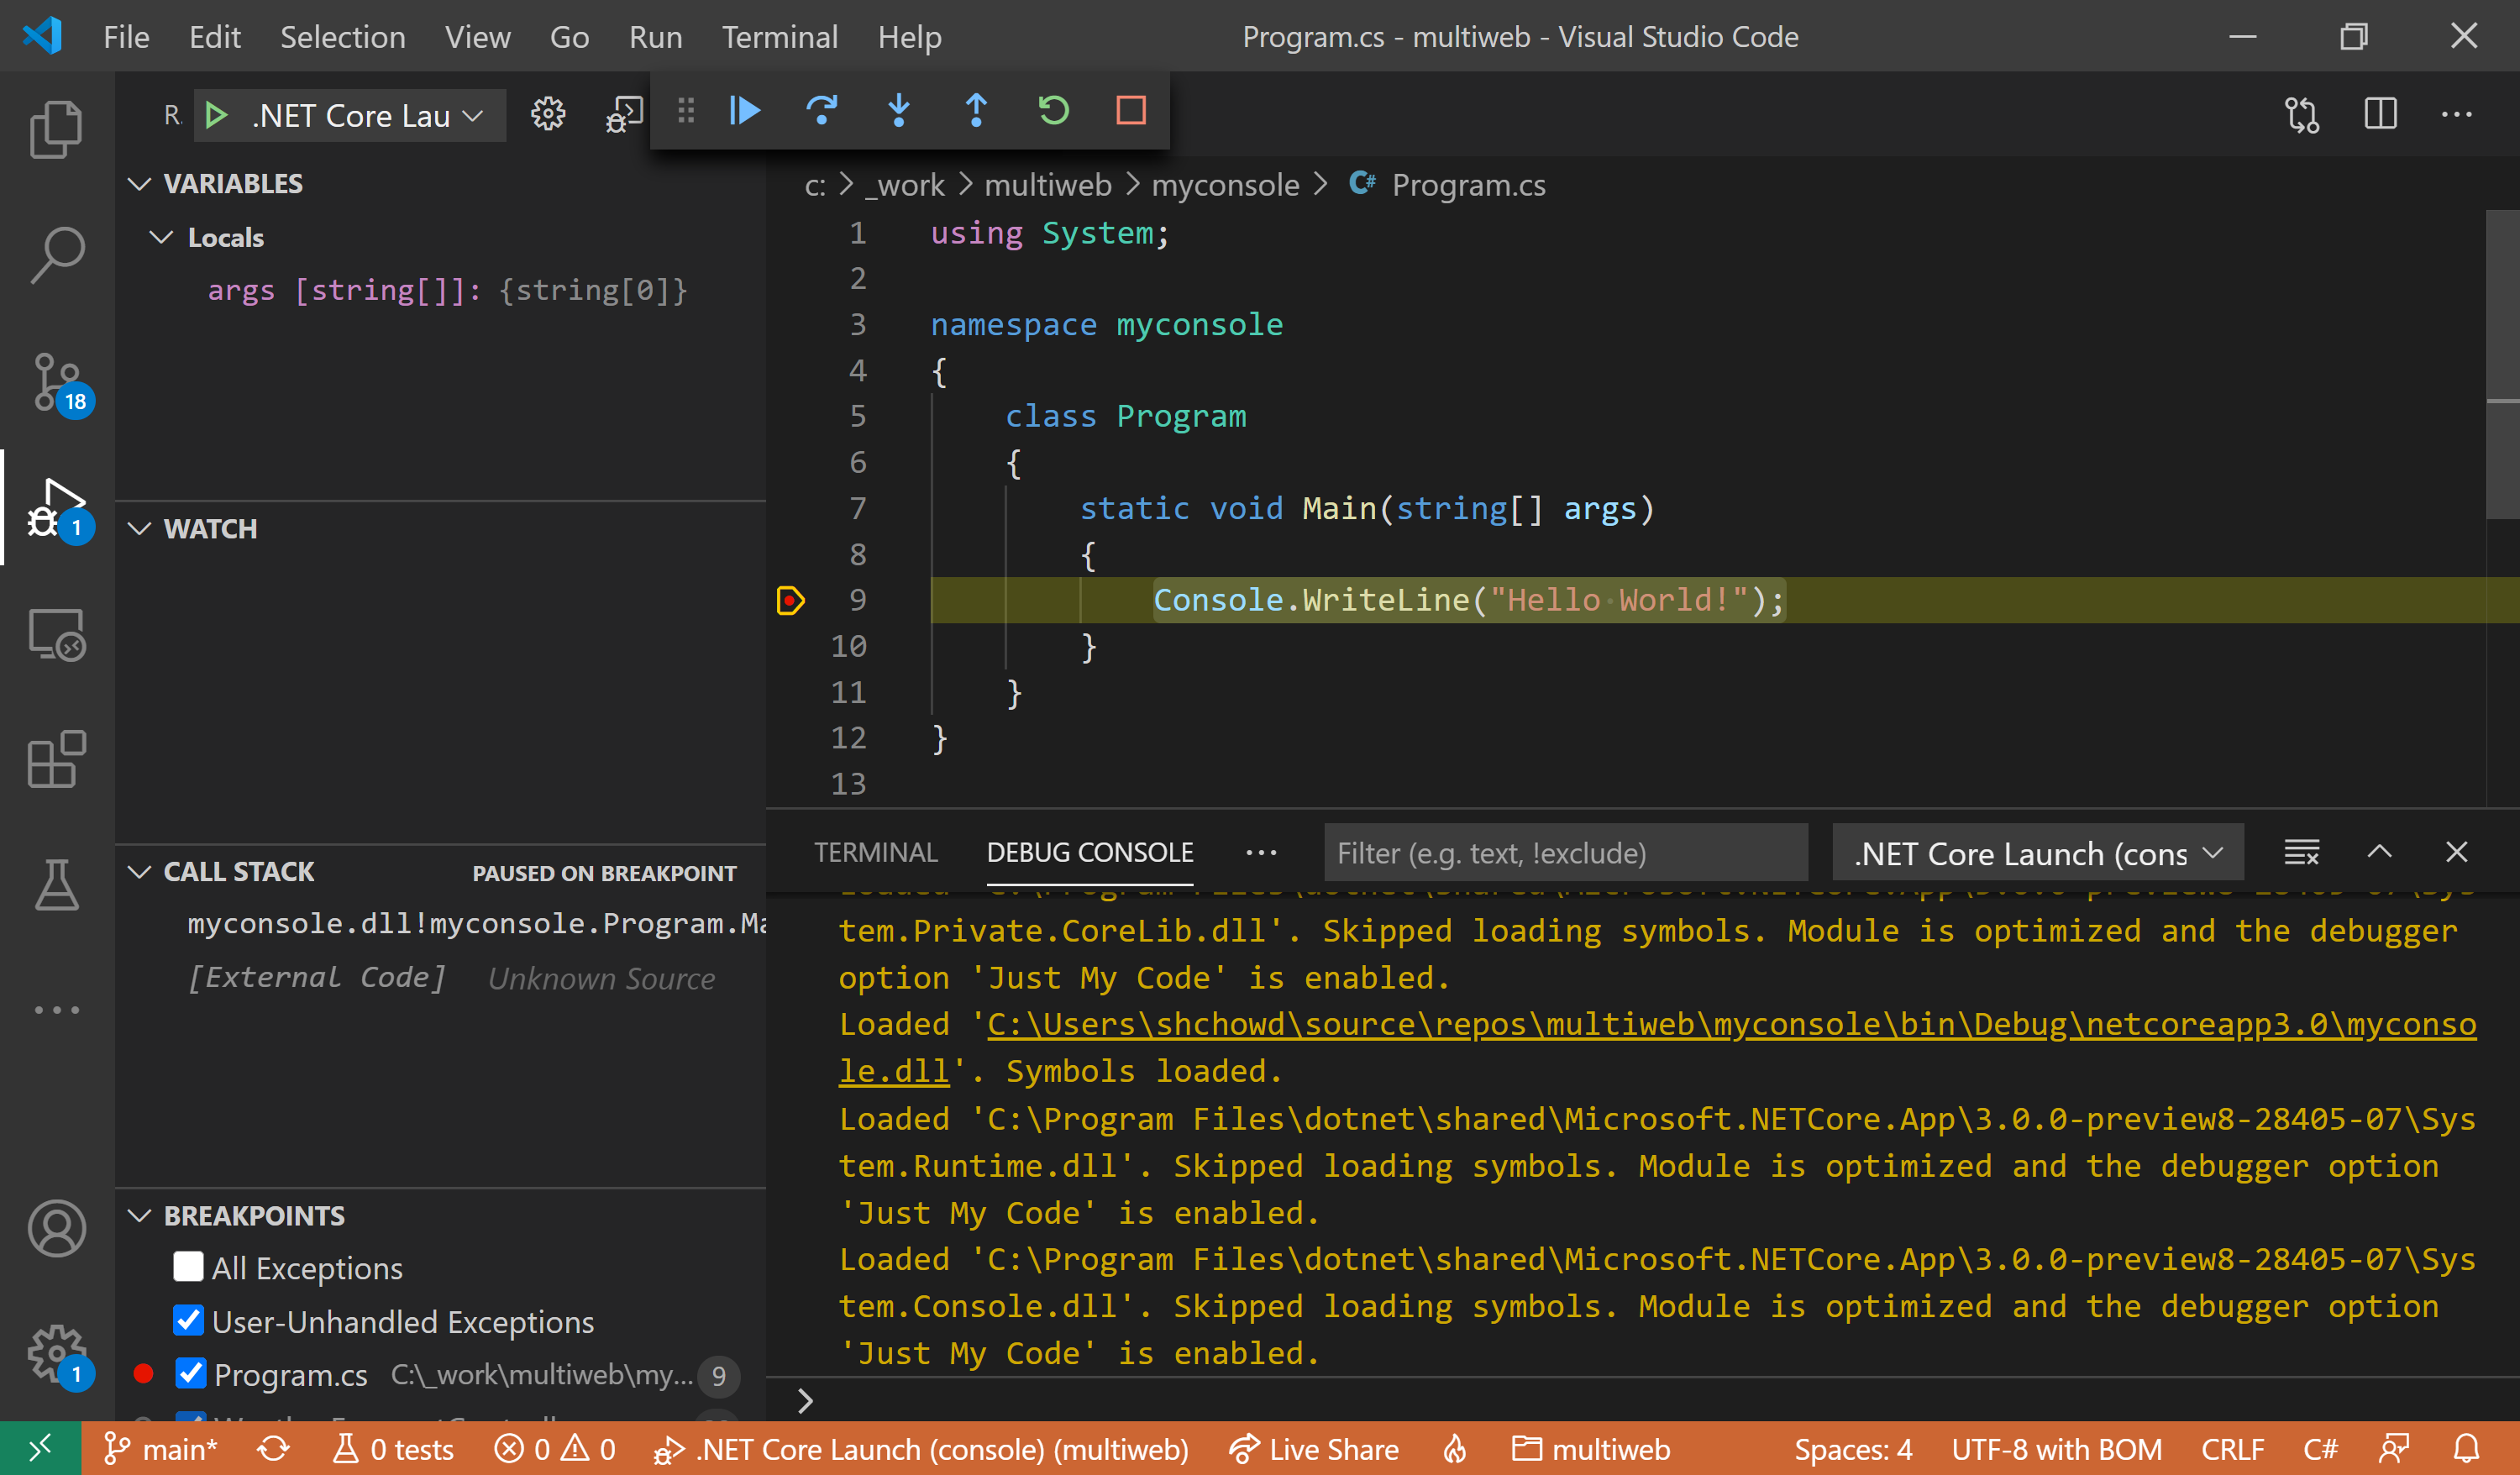 ## Debugging with Breakpoints From the aforementioned Debug Panel, run the Web API project and then the Console project by clicking the Play/Debug button for each launch configuration. **Note**: when the web browser launches at the root of the website, you may browse to the WeatherForecast Controller manually, e.g. https://localhost:5001/WeatherForecast You should see each program pause at the breakpoints you set earlier. e.g. Breakpoint in Web API project:  e.g. Breakpoint in Console project:  ## Continue Running Press the Play/Continue button to continue running while debugging. Observe the output in a web browser (for the Web API project) or the Terminal within VS Code (for the Web API project) e.g. Output in Web API project: 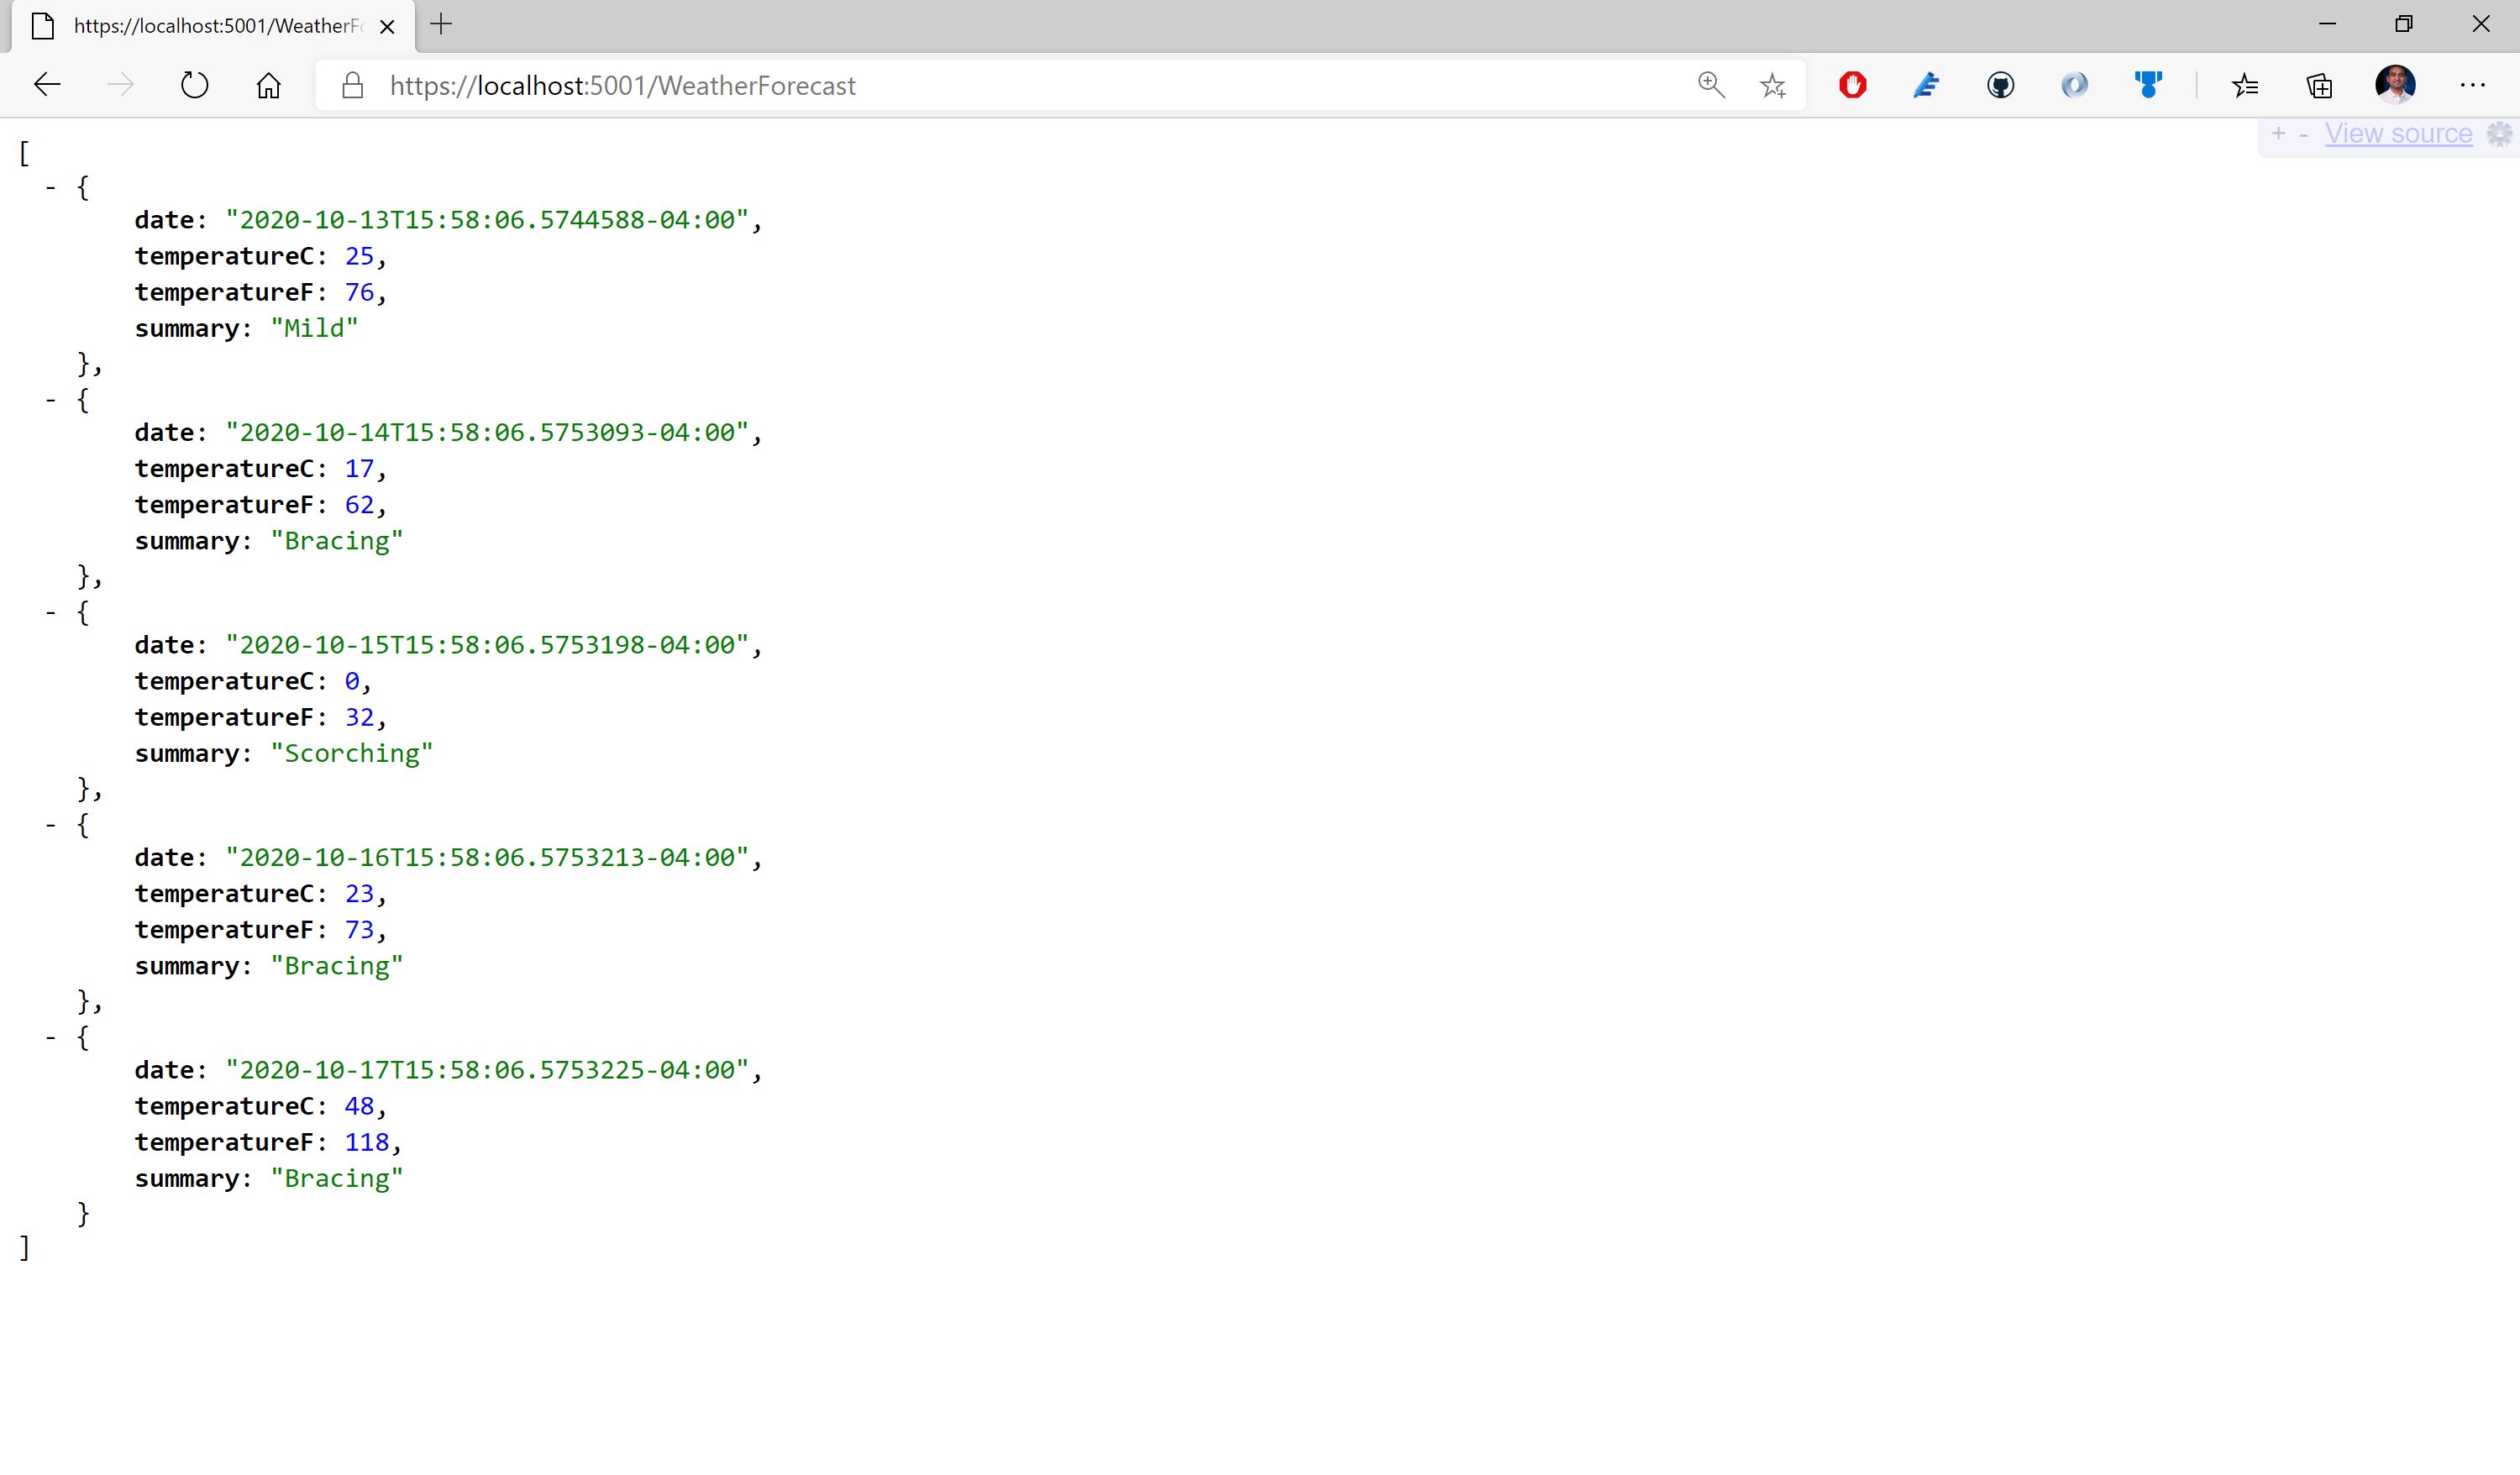 e.g. Output in Console project: 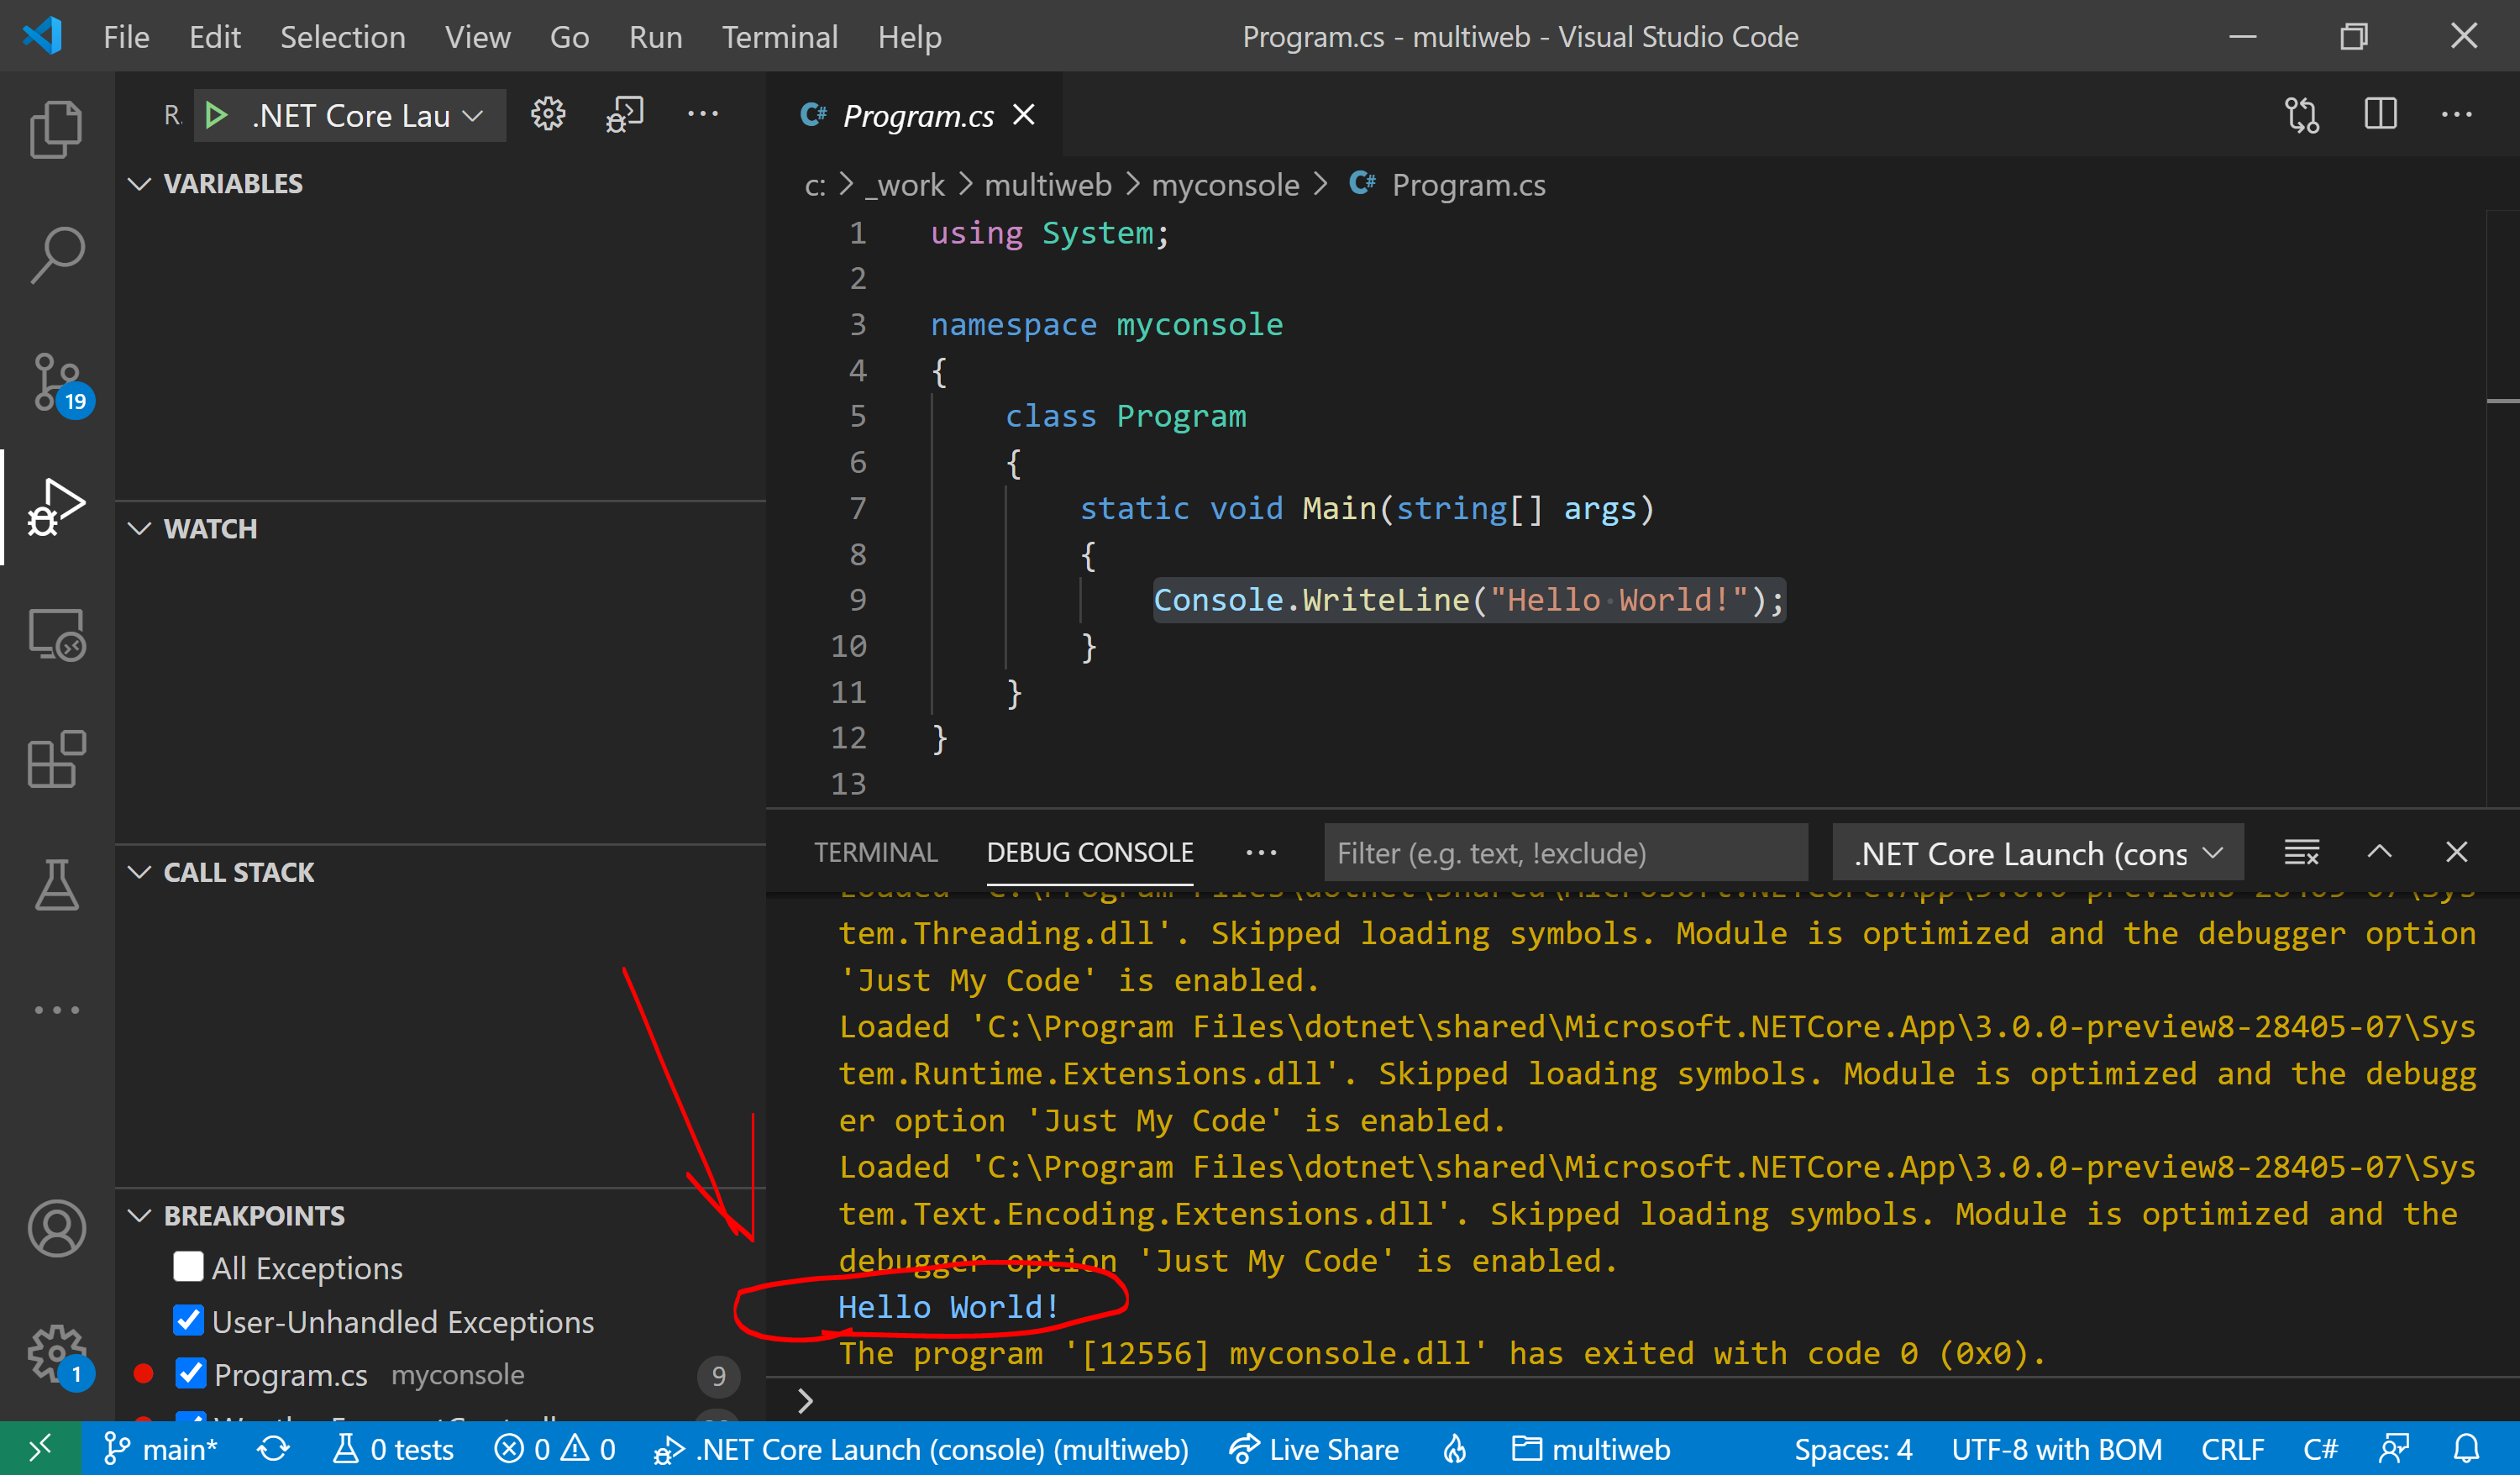 ## Optional: Run Multiple Projects As a bonus, I have added a Compounds section to the launch.json file. ``` "compounds": [ { "name": "Both Console & Web API", "configurations": [ ".NET Core Launch (console)", ".NET Core Launch (web)" ] } ``` This will allow you to launch both the Console app (in the Terminal) and the Web API app (in a browser) in rapid succession, with 1 click. e.g. Debugging multiple projects: