KO
|
EN
gitlite — search
Search
#typescript
#ai-agents
#deepseek-harness
#dsh-plugin
#open-source
#ai
#cli
#dsh
#claude-code
#codex
#developer-tools
#react
ggpipe
★ 57
Open GitHub ↗
ggplot with the pipe
Download README (.md)
Explore Similar Repositories
retrofit-kotlin-sample
:
Sample app for using Retrofit + RxJava + Kotlin in Android.
active_interaction-extras
:
Useful extensions for active_interaction gem
InputAccessoryView
:
Input Accessory View for Commenting and Chat User Interfaces built in Swift, if you like it please "☆"
jannlp
:
No description available.
go-rest-api-boilerplate
:
Go production ready REST API starting kit, with Swagger documentation
// repository documentation
Was this content helpful?
★ 0
(0 ratings)
Select Rating:
★
★
★
★
★
Submit Feedback
Recent Feedback
×
Download README
Do you want to download the
README.md
file for
ggpipe
?
Download (.md)
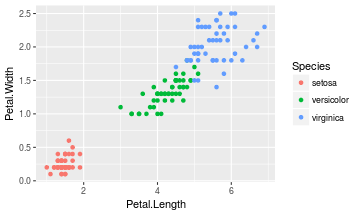
<!-- README.md is generated from README.Rmd. Please edit that file --> ggpipe ====== *ggplot with the pipe* This package wraps most `ggplot2` functions so they work with the pipe `%>%` with [minimal overhead](http://rpubs.com/zeehio/ggpipe-overhead) (if noticeable). [](https://travis-ci.org/zeehio/ggpipe) [](https://cran.r-project.org/package=ggpipe) Installation ------------ You can install ggpipe from github with: ``` r # install.packages("devtools") devtools::install_github("zeehio/ggpipe") ``` Example ------- ``` r # as ggpipe wraps ggplot2 functions, do not use library(ggplot2) in your scripts library(ggpipe) ggplot(mtcars) %>% geom_point(aes(x = mpg, y = disp)) ``` 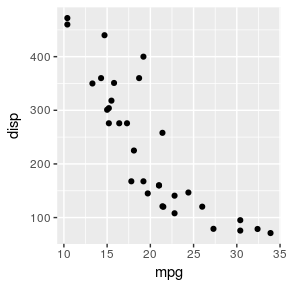 This package provides an additional `unggplot()` function to get back the data from the plot, so multiple plots could be generated on a single pipe: ``` r iris_sepal_png <- "README-iris_sepal.png" iris_petal_png <- "README-iris_petal.png" iris %>% ggplot() %>% geom_point(aes(x = Sepal.Length, y = Sepal.Width, color = Species)) %>% ggsave(iris_sepal_png, height = 3, width = 5, dpi = 72) %>% unggplot() %>% ggplot() %>% geom_point(aes(x = Petal.Length, y = Petal.Width, color = Species)) %>% ggsave(iris_petal_png, height = 3, width = 5, dpi = 72) %>% unggplot() %>% head() #> Sepal.Length Sepal.Width Petal.Length Petal.Width Species #> 1 5.1 3.5 1.4 0.2 setosa #> 2 4.9 3.0 1.4 0.2 setosa #> 3 4.7 3.2 1.3 0.2 setosa #> 4 4.6 3.1 1.5 0.2 setosa #> 5 5.0 3.6 1.4 0.2 setosa #> 6 5.4 3.9 1.7 0.4 setosa ``` Plot the two figures: ``` r knitr::include_graphics(iris_sepal_png) ``` 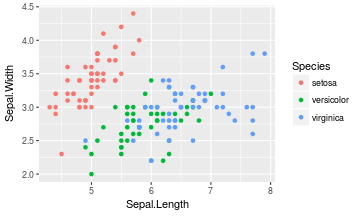 ``` r knitr::include_graphics(iris_petal_png) ```