KO
|
EN
gitlite — search
Search
#javascript
#python
#hacktoberfest
#react
#ai
#typescript
#llm
#go
#golang
#android
#machine-learning
#rust
#deep-learning
#linux
Zaiba2
★ 18
Open GitHub ↗
SQL Server Monitoring Dashboard "Zaiba2"
Download README (.md)
Explore Similar Repositories
RHCE_Practice_Test
:
This is my practice test and files used to pass the RHCE for RHEL 7
SPFxThemeWiz
:
Create your SharePoint Modern Site Theme in seconds with this easy to use wysiwyg editor
tip2018
:
No description available.
california-business-entities
:
Corporations and limited-liability companies registered with the California Secretary of State.
underwater_enhancement
:
Matlab implementation of Local Color Mapping combined with Color Transfer for Underwater Image Enhancement paper.
// repository documentation
Was this content helpful?
★ 0
(0 ratings)
Select Rating:
★
★
★
★
★
Submit Feedback
Recent Feedback
×
Download README
Do you want to download the
README.md
file for
Zaiba2
?
Download (.md)
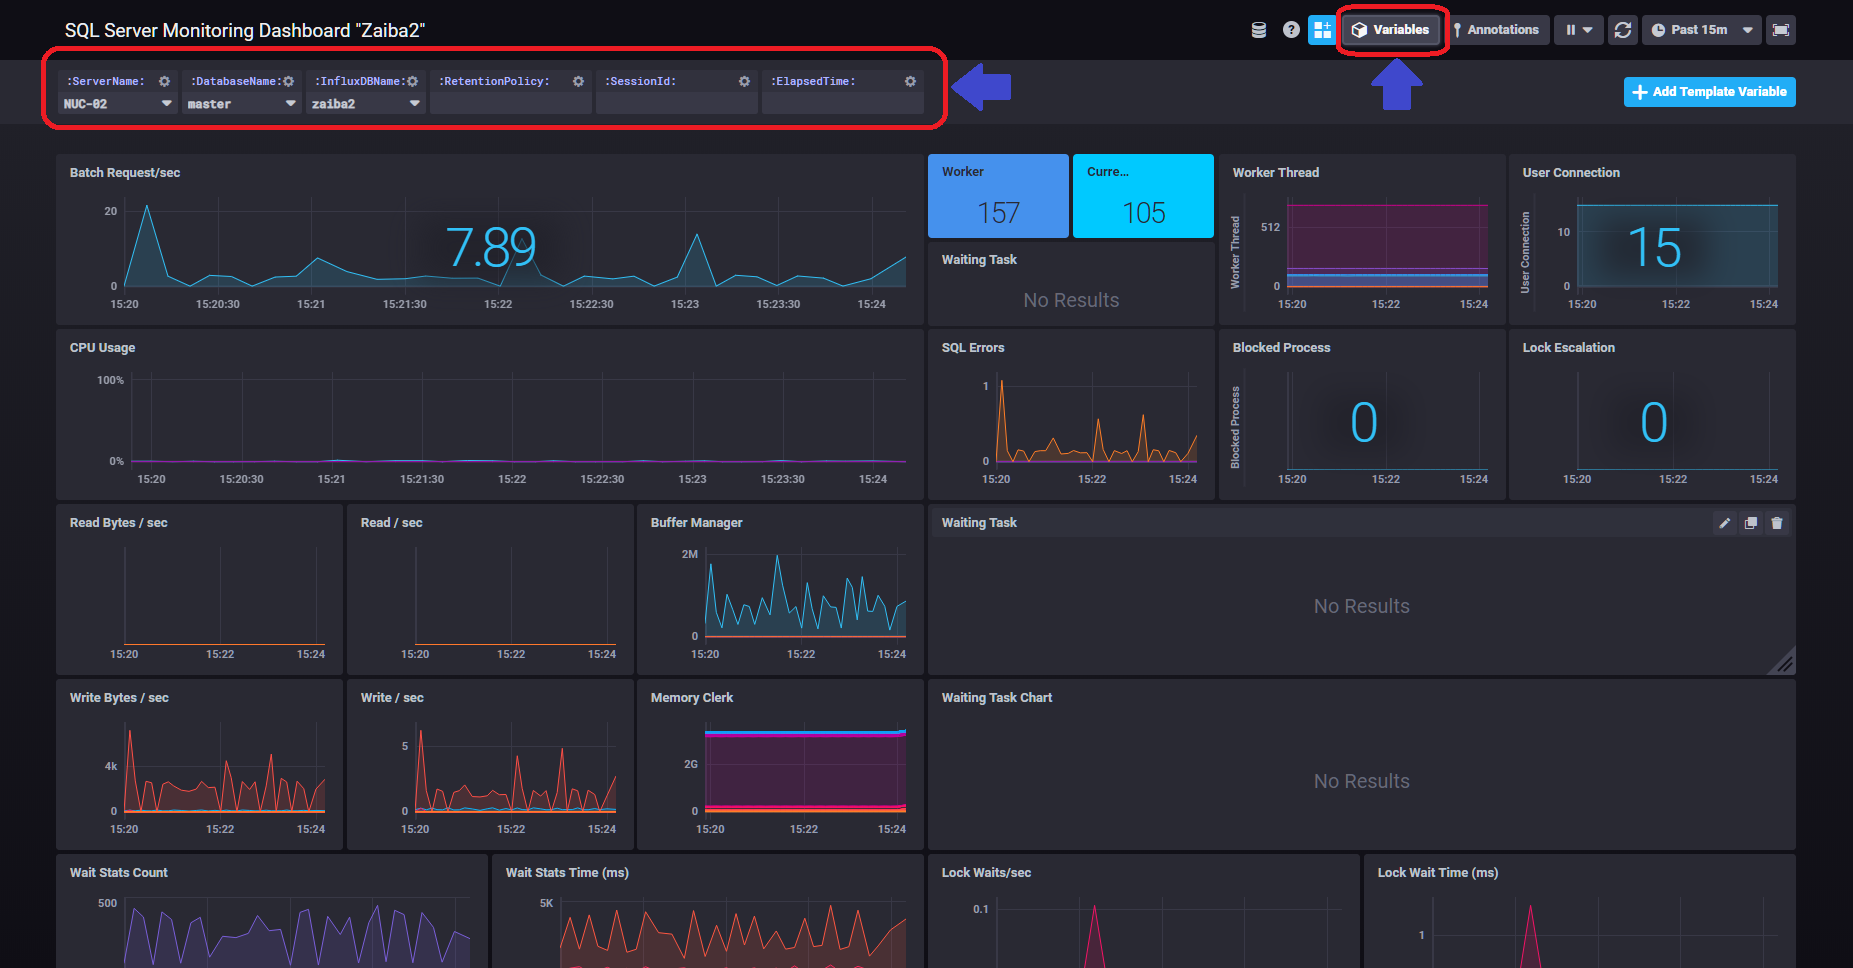
# SQL Server Simple Monitoring Tool "Zaiba2" `Zaiba2` is a tool for easy collection of SQL Server metrics in a Windows environment. Collect and visualize metrics with the components of the [TICK Stack](https://www.influxdata.com/time-series-platform/) and the PowerShell script. You can visualize information in SQL Server 2008 or later and SQL Database. 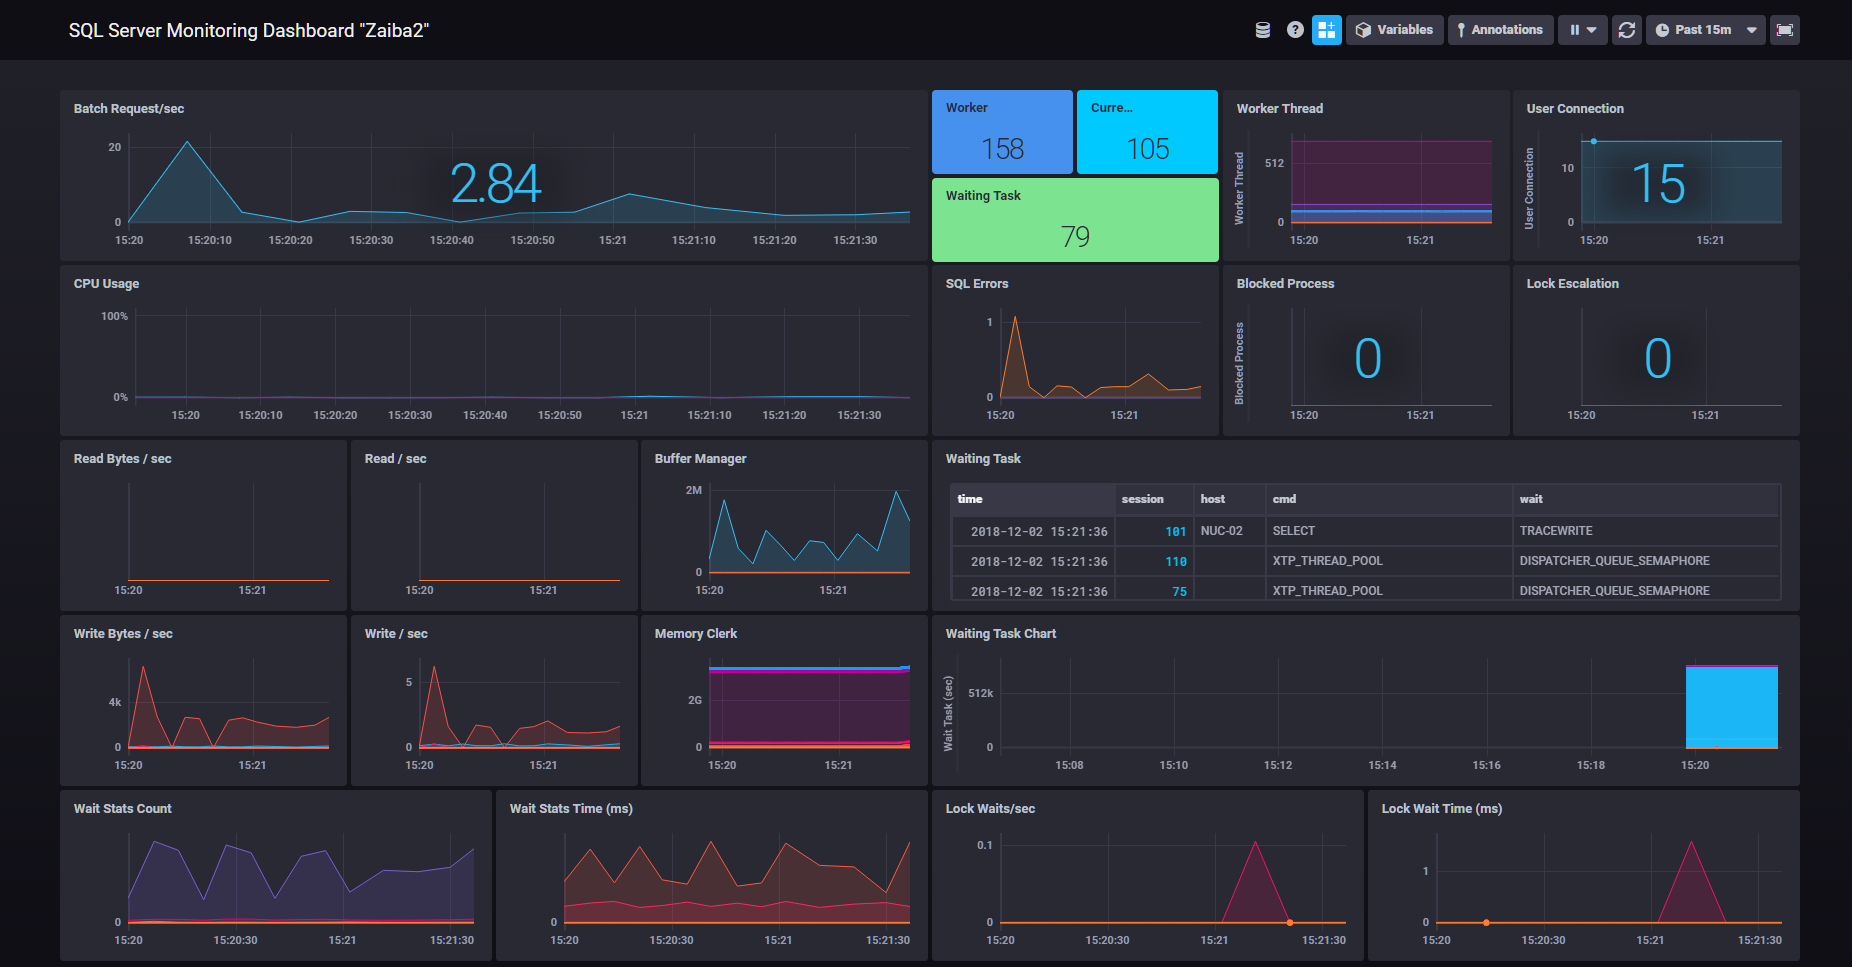 Get SQL Server metrics in `Zaiba2.ps1`, store them in `InfluxDB`, and visualize them in `Chronograf`. Collecting metrics is done in a PowerShell script, so you can easily make changes. (`Zaiba2.ps1` can also be run with a PowerShell Core.) 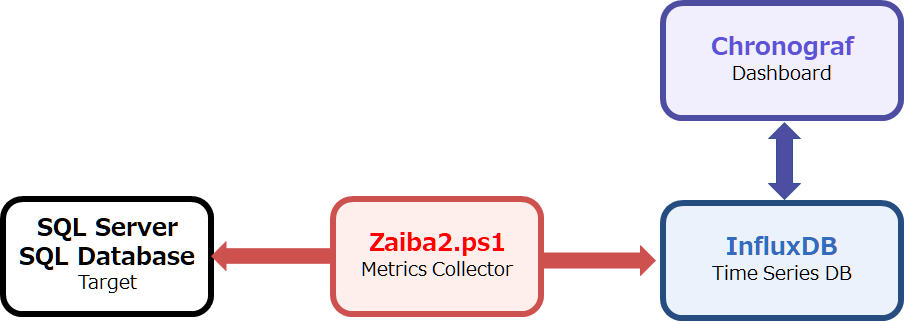 ## Setup When running on Windows 10 / Windows Server 2016, setup can be executed by script. You can setup it by running [Setup/Setup-Zaiba2.ps1](./Setup/Setup-Zaiba2.ps1). (The file is stored in `C:\Zaiba2` by default) 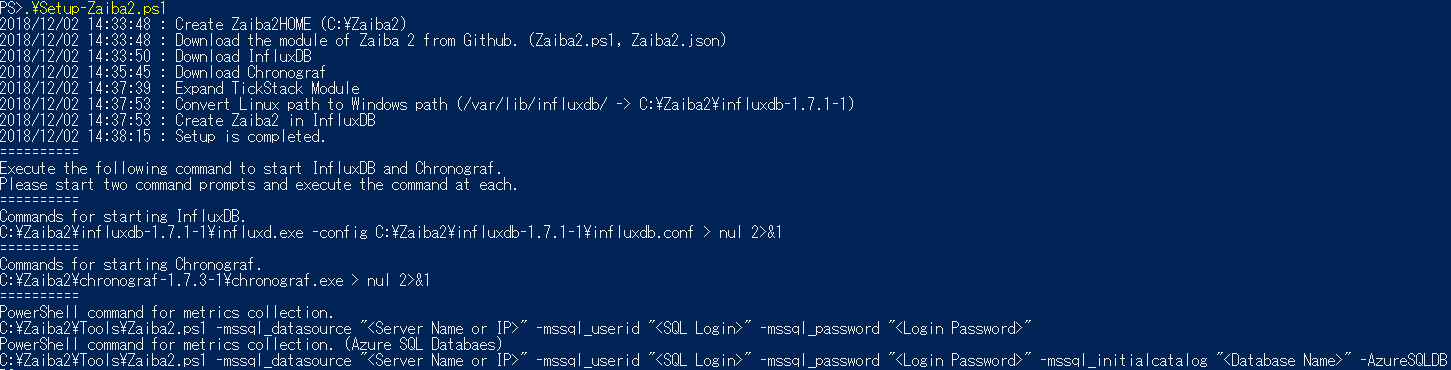 If `Setup-Zaiba2.ps1` can not be executed normally, execute the InfluxDB and Chronograf setup with reference to the following information. [Running the TICK Stack on Windows](https://www.influxdata.com/blog/running-the-tick-stack-on-windows/) ## Let's Starting First, start InfluxDB and Chronograf. Start two command prompts and execute the following command. ``` C:\Zaiba2\influxdb-1.7.1-1\influxd.exe -config C:\Zaiba2\influxdb-1.7.1-1\influxdb.conf > nul 2>&1 ``` ``` C:\Zaiba2\chronograf-1.7.3-1\chronograf.exe > nul 2>&1 ``` Chronograf can be accessed with http://localhost:8888. 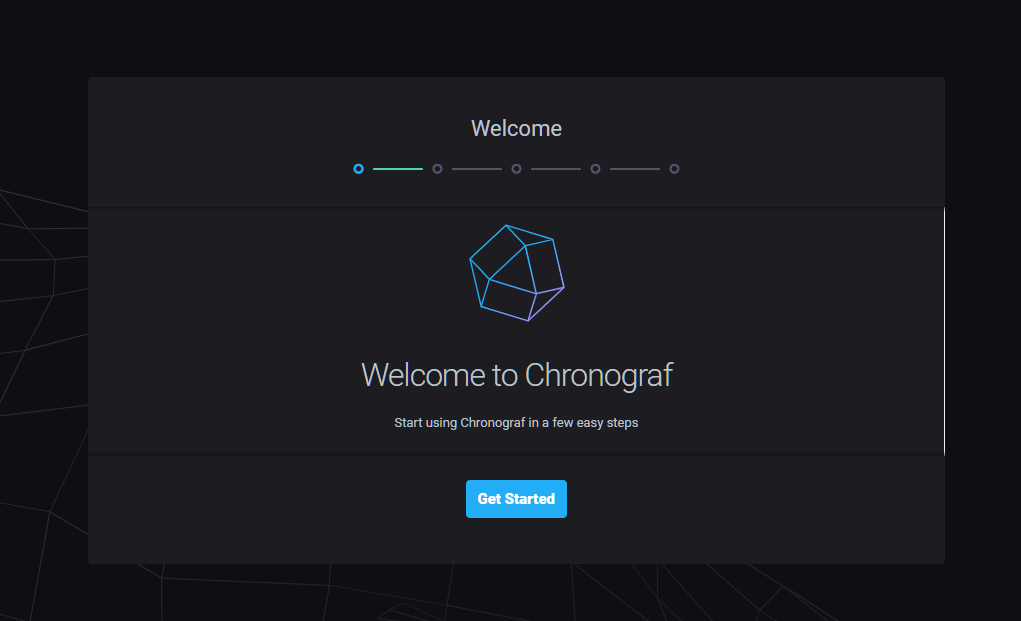 Click `Get Started` to display the Add Connection screen. Specify `Zaiba2` for `Telegraf Database Name` and create a connection. 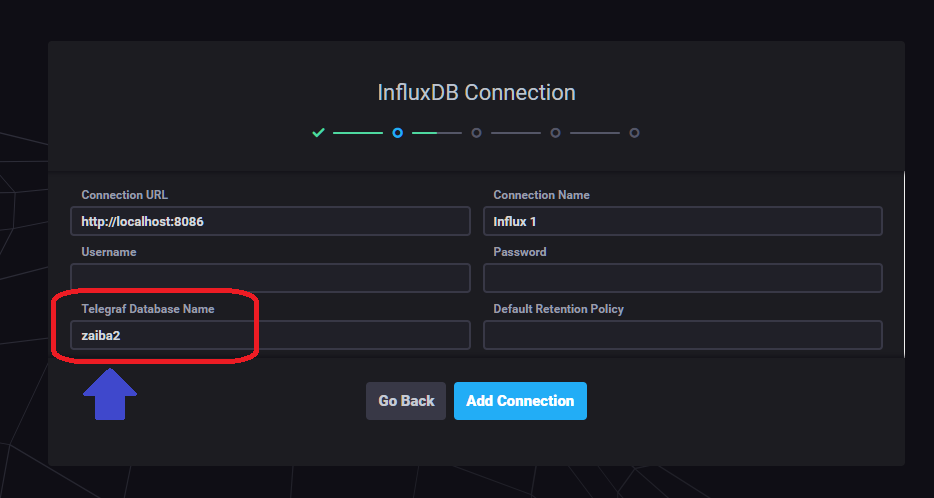 After adding connections, import the Zaiba2 dashboard. 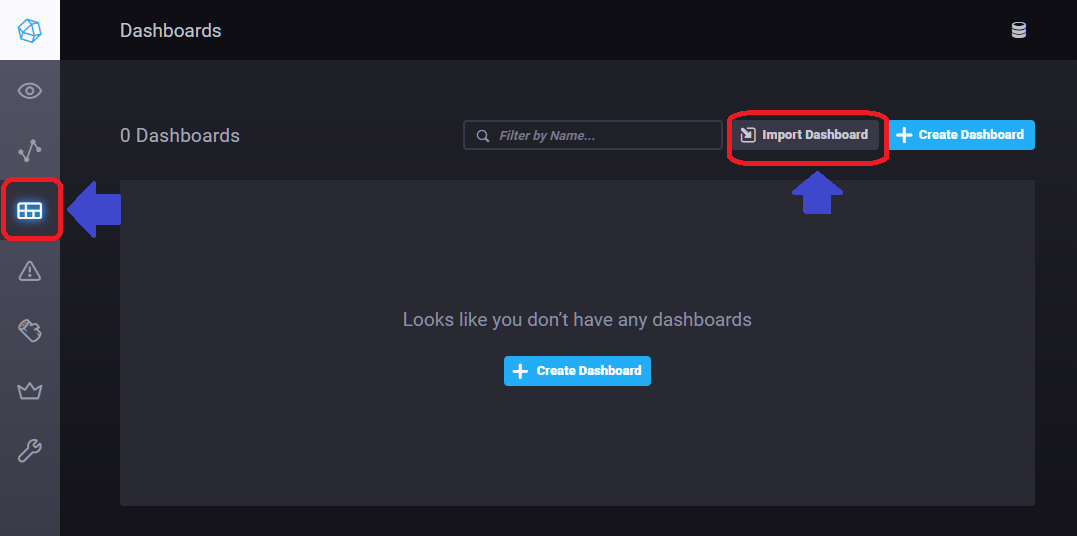 If you set up with a script, drag and drop `C:\Zaiba2\Tools\zaiba2.json`. If you set up manually, drag and drop the file of [./Chronograf/SQL Server Monitoring Dashboard _Zaiba2_.json](./Chronograf/SQL%20Server%20Monitoring%20Dashboard%20_Zaiba2_.json) 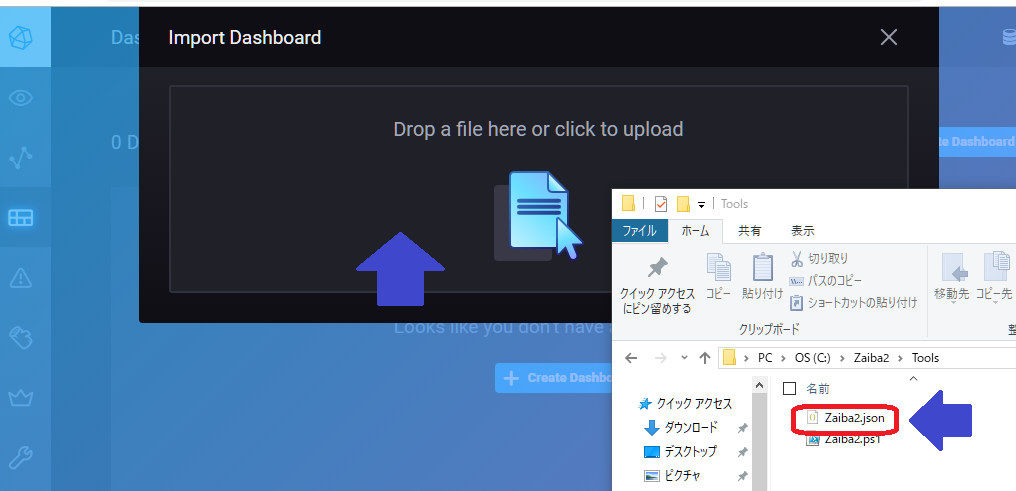 If Reconcile Sources is displayed, please select `Influx 1`. 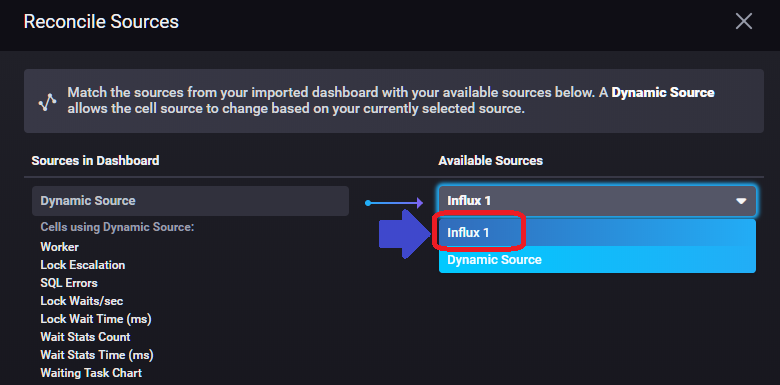 Let's start getting metrics. In PowerShell, run `Zaiba2.ps1`. ``` C:\Zaiba2\Tools\Zaiba2.ps1 -mssql_datasource "<Server Name or IP>" -mssql_userid "<SQL Login>" -mssql_password "<Login Password>" ``` To obtain information on Azure SQL Database, execute the following command. ``` C:\Zaiba2\Tools\Zaiba2.ps1 -mssql_datasource "<Server Name or IP>" -mssql_userid "<SQL Login>" -mssql_password "<Login Password>" -mssql_initialcatalog "<Database Name>" -AzureSQLDB ``` Please open the dashboard with Chronograf when metrics collection starts normally. 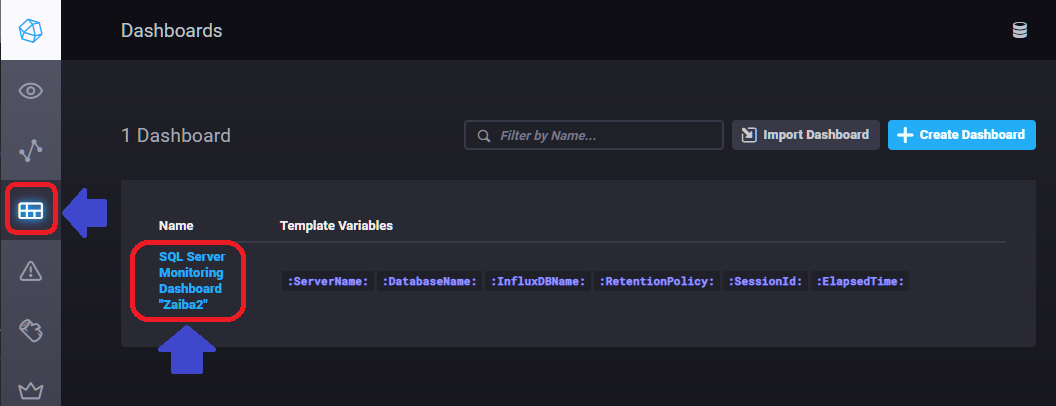 Variables can be changed by clicking on Variables. If you get metrics of more than one server, please change the variable.