KO
|
EN
gitlite — search
Search
#javascript
#python
#hacktoberfest
#react
#ai
#typescript
#llm
#go
#golang
#android
#machine-learning
#rust
#deep-learning
#linux
grafana_plugins_practice
★ 13
Open GitHub ↗
grafana插件开发
Download README (.md)
Explore Similar Repositories
Image-Editor-Python-tkinter
:
Still in progress
miqversions
:
Because naming is hard. Really, really hard.
Unity-Version-Launcher
:
Launch any of your installed versions of Unity directly from this.
PynqRadio
:
Skeletal repository for GNU Radio WBFM implementation on Pynq board
520sms
:
Setting Your SMS App As The Default SMS App Since KitKat
// repository documentation
Was this content helpful?
★ 0
(0 ratings)
Select Rating:
★
★
★
★
★
Submit Feedback
Recent Feedback
×
Download README
Do you want to download the
README.md
file for
grafana_plugins_practice
?
Download (.md)
# Grafana 插件开发 上一次分享提到过Grafana的插件氛围三种类型(Panel, Datasource, App),这一次主要记录Panel类型的插件开发. ## 0. 起手式 根据官网的描述, 插件包一般放在`/var/lib/grafana/plugins`或者`data/plugins`(相对Grafana源码目录). 前者是生产环境, 后者是开发环境. 所以我们这一次选择后者, 毕竟一会儿要从源码修改Grafana的前端代码, 然后启动go语言编写的后端. > 基础知识准备: > angularjs, systemjs, typescript, jquery, echarts, grunt, nodejs and golang. ## 1. 目录结构 先把官网上说明需要的文件目录加上. ``` johnnyb-awesome-datasource |-- dist # 存放编译打包后的插件代码 |-- spec # 测试代码 | |-- datasource_spec.js | |-- query_ctrl_spec.js | |-- test-main.js |-- src # 插件源码 | |-- img # 需要的图片, 比如LOGO, 可选 | | |-- logo.svg | |-- partials # 界面文件, 可选 | | |-- annotations.editor.html | | |-- config.html | | |-- query.editor.html | |-- datasource.js | |-- module.js # 唯一入口文件 | |-- plugin.json # 插件描述文件 | |-- query_ctrl.js |-- Gruntfile.js # Grunt任务 |-- LICENSE |-- package.json |-- README.md # 这也会显示在插件说明中 ``` > README.md: The only difference from how GitHub renders markdown is that html is not allowed. 实际上并不需要严格按照上述目录存放文件, 关键点在于: 插件目录下需要有`src/`, `dist/`. `src/`中需要有`module.js`和`plugin.json`. 其他开心就好. 所以实际上, 我的目录结构是这样: ``` practice-panel |-- dist # 存放编译打包后的插件代码 |-- src # 插件源码 | |-- partials # 界面文件, 可选 | | |-- module.html | | |-- module.editor.html | |-- module.js # 唯一入口文件 | |-- plugin.json # 插件描述文件 | |-- controller.js # 分离出来的Controller, 也可全部放在module.js里面 |-- Gruntfile.js # Grunt任务描述 |-- package.json |-- README.md ``` ## 2. 插件描述文件(.json) 然后来认识一个文件, 这个文件是用来描述插件的. 包括插件的**唯一**标识, 名字, 作者, 版本等等. 全文是这样的: ```json { "id": "", "type": "", "name": "", "info": { "description": "", "author": { "name": "", "url": "" }, "keywords": [], "logos": [ "small": "", "large": "" ], "version": "" }, "dependencies": { "grafanaVersion": "", "plugins": [] } } ``` 具体的含义, 参考附录中的官方说明链接. 本次的内容参考源码文件. ## 3. 入口文件 这基本上就是约定, Grafana会从插件包的`dist/`第一个读取的文件就是`module.js`文件. 不管用什么语言编写, 最终都要保证`dist/module.js`可读. ## 4. 可用依赖资源 Grafana的前端模块化方案采用的[Systemjs](https://github.com/systemjs/systemjs). 如果熟悉任何一种模块化方案都行, 这里的影响并不是很大, 除了需要添加依赖资源. 在插件开发过程中, 开发者是**无法添加任何依赖资源**的. 因为插件是作为Grafana前端整体的一部分在运行. 所有的资源配置都写在Grafana源码目录的`public/app/system.conf.js`文件中, 资源都放在`public/vendor/`目录中. 默认可用资源如下: ``` virtual-scroll mousetrap remarkable tether eventemitter3 tether-drop moment jquery lodash-src lodash angular bootstrap angular-route angular-sanitize angular-ui angular-strap angular-dragdrop angular-bindonce spectrum bootstrap-tagsinput jquery.flot jquery.flot.pie jquery.flot.selection jquery.flot.stack jquery.flot.stackpercent jquery.flot.time jquery.flot.crosshair jquery.flot.fillbelow jquery.flot.gauge d3 jquery.flot.dashes ``` 是的, 像D3, jquery, moment, lodash这些非常有用的图表基础库都有了, 甚至很贴心的连AngularJS全家桶都有. 美中不足的是AngularJS版本偏低: `1.6.1`. 但这一次练习, 我们要用echarts来构建图表. 很遗憾, Grafana没有这项资源. 所以总共需要修改二个地方. - 将`echarts.min.js`放入`public/vendor/`目录 - 修改`public/app/system.conf.js`文件, 在`paths`节点中添加代码: `'echarts': 'vendor/echarts.min.js',` 上下文看起来像这样: ```javascript 'tether-drop': 'vendor/npm/tether-drop/dist/js/drop.js', 'moment': 'vendor/moment.js', 'echarts': 'vendor/echarts.min.js', 'jquery': 'vendor/jquery/dist/jquery.js', ``` ## 5. 开始编码 ### MetricsPanelCtrl类 准备工作基本完成了, 但是编码之前, 需要认识一个类: `MetricsPanelCtrl`. 这个类的源码文件位于Grafana源码目录下`public/app/features/panel/metrics_panel_ctrl.ts`. `MetricsPanelCtrl`类继承自`PanelCtrl`类, 是我们完成本次Panel类型插件开发必须要用到的. 它主要是解决了以下三个问题: 1. 在进入编辑状态后, 使metrics Tab成为默认面板. ```javascript constructor($scope, $injector) { super($scope, $injector); // make metrics tab the default this.editorTabIndex = 1; // ... other code } ``` 2. 订阅事件: ```javascript this.events.on('refresh', this.onMetricsPanelRefresh.bind(this)); this.events.on('init-edit-mode', this.onInitMetricsPanelEditMode.bind(this)); this.events.on('panel-teardown', this.onPanelTearDown.bind(this)); ``` 3. 提供设置数据源后的响应: ```javascript setDatasource(datasource) { // ... other code this.panel.datasource = datasource.value; this.datasourceName = datasource.name; this.datasource = null; this.refresh(); } ``` ### 插件事件 因为文档中并无特别描述, 所以以下是**已知的**插件支持的事件: - `refresh` can be used to response when refresh button was clicked. - `init-edit-mode` can be used to add tabs when editing a panel - `panel-teardown` can be used for clean up - `data-received` is an event in that is triggered on data refresh and can be hooked into - `data-snapshot-load` is an event triggered to load data when in snapshot mode. - `data-error` is used to handle errors on dashboard refresh. ### 编写一个controller.js Controller类必须实现link方法或者init方法. 这是Grafana的插件机制决定的. 与此同时, Controller的实例对象也将作为AngularJS组件的上下文对象存在. ```javascript // app/core/directives/plugin_component.ts function getPluginComponentDirective(options) { // other code return function() { return { // other code link: (scope, elem, attrs, ctrl) => { if (ctrl.link) { ctrl.link(scope, elem, attrs, ctrl); } if (ctrl.init) { ctrl.init(); } } } } } ``` 而这个函数是作为AngularJS的指令处理函数存在的. 所以我们的controller.js看起来至少应该是这样的: ```javascript import { MetricsPanelCtrl } from 'app/plugins/sdk'; export class Controller extends MetricsPanelCtrl { constructor() { // initialize // subscribe events } link(scope, elem, attrs, ctrl) { // impelement linking } } ``` *完整实现细节请参考源码文件.* 是的, 此时还没有界面. 在编写界面之前, 我们先了解一下插件的二种状态. ## 6. 插件状态 插件有二种状态, 一种是只读状态, 一种是编辑状态. 只读状态就是打开一个dashboard时各个Panel表现的状态. 编辑状态是点击"Edit"之后, 进入的可以影响数据源的状态. 我们需要分别为这二种状态编写页面. *完整实现细节参考源码文件.* ## 7. HTML + CSS Grafana提供一些布局样式和外观样式. 非常不幸, 我没有在官方文档上找到对应的样式说明. 不过幸运的是, 插件目前只有三种, 而且三种都提供了Example代码. 分别是: [https://github.com/grafana/piechart-panel](https://github.com/grafana/piechart-panel) [https://github.com/grafana/simple-json-datasource](https://github.com/grafana/simple-json-datasource) [https://github.com/grafana/kubernetes-app](https://github.com/grafana/kubernetes-app) 这一次练习则是copy的piechart-panel的编辑页面. 用起来有点类似bootstrap的感觉. 好了, 重点来了: **在编写完成界面后, 需要将界面和controller关联在一起.** 只读状态的界面关联方法是在controller.js中声明完Controller类后, 添加静态属性字段: ```javascript Controller.templateUrl = './partials/module.html'; ``` 编辑状态的界面则需要在`init-edit-mode`事件处理函数中注册: ```javascript onInitEditMode() { this.addEditorTab('Options', 'public/plugins/practice-panel/partials/module.editor.html', 2); } ``` *完整实现细节参考源码文件.* ## 8. 编译打包 编译Grafana官方使用的是Grunt, 实际上只要按照目录结构来, 用什么打包工具并不重要. `grunt` 一个练习插件就这么完成了. ## 9. 总结 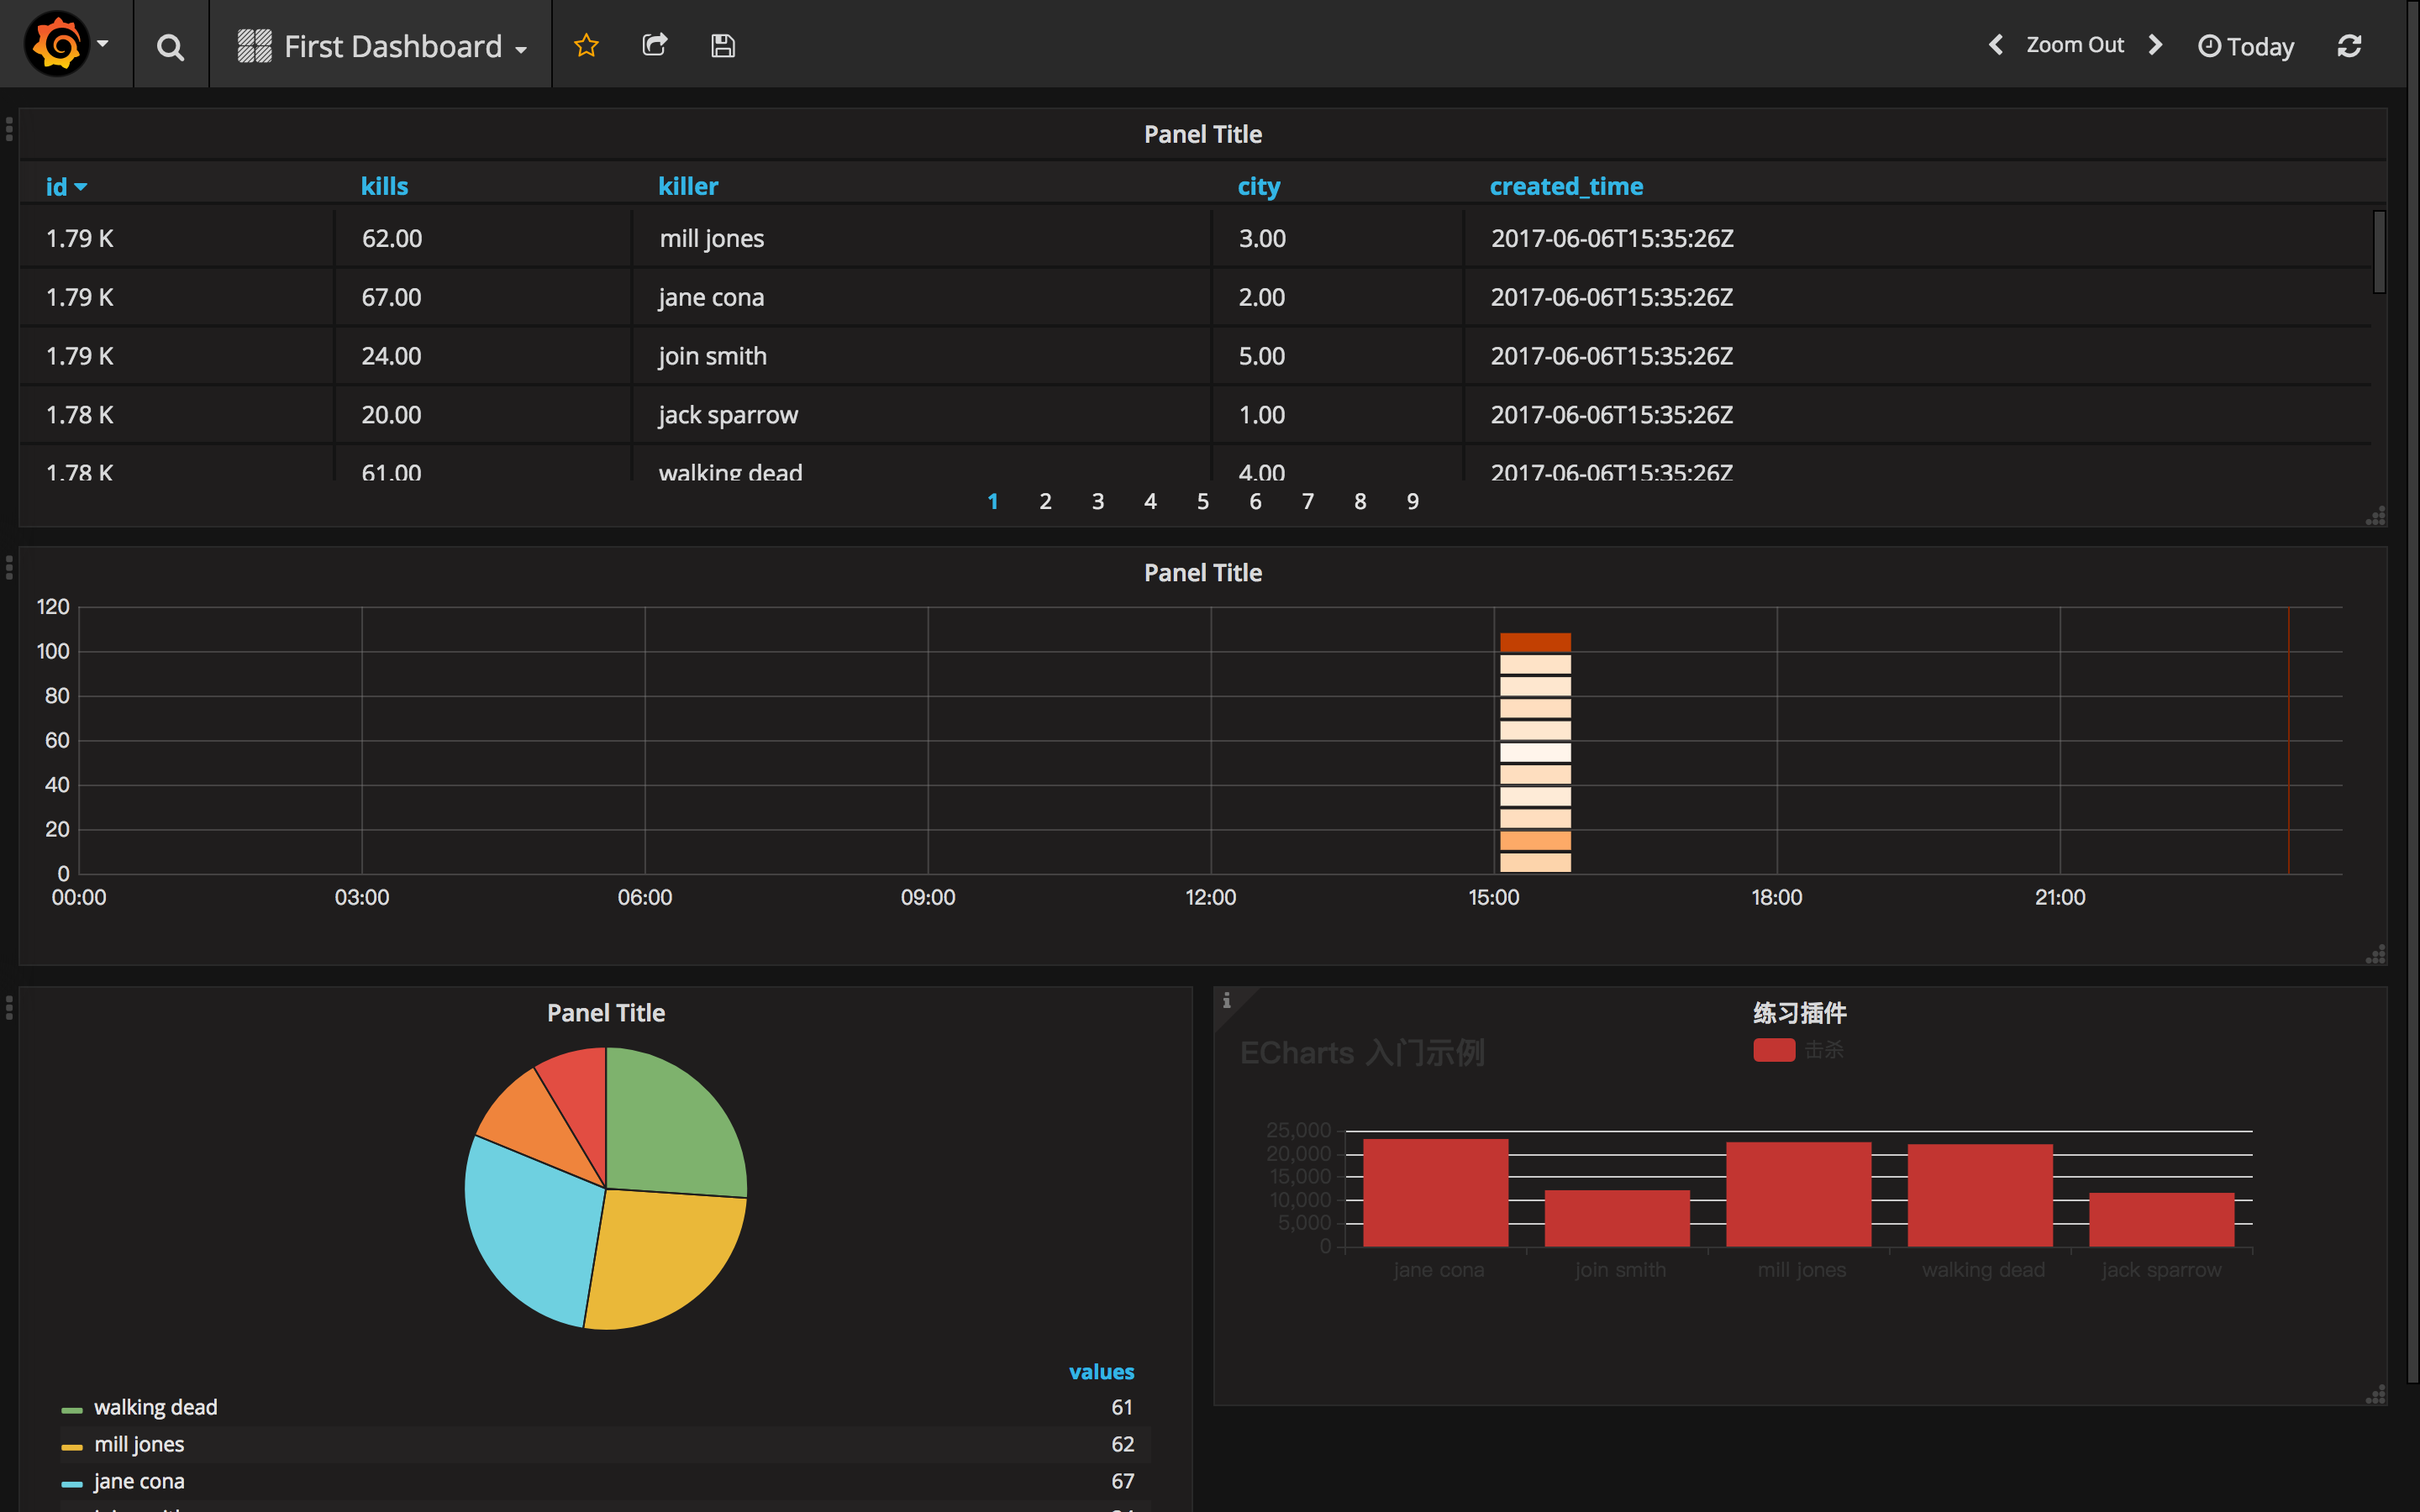一种数据的四种表现形式. 其中右下角红色的柱状图即本次练习插件. 图表数据Grafana只支持二种, 时序图和非时序图. 非时序图仅返回一个普通的数据结构: 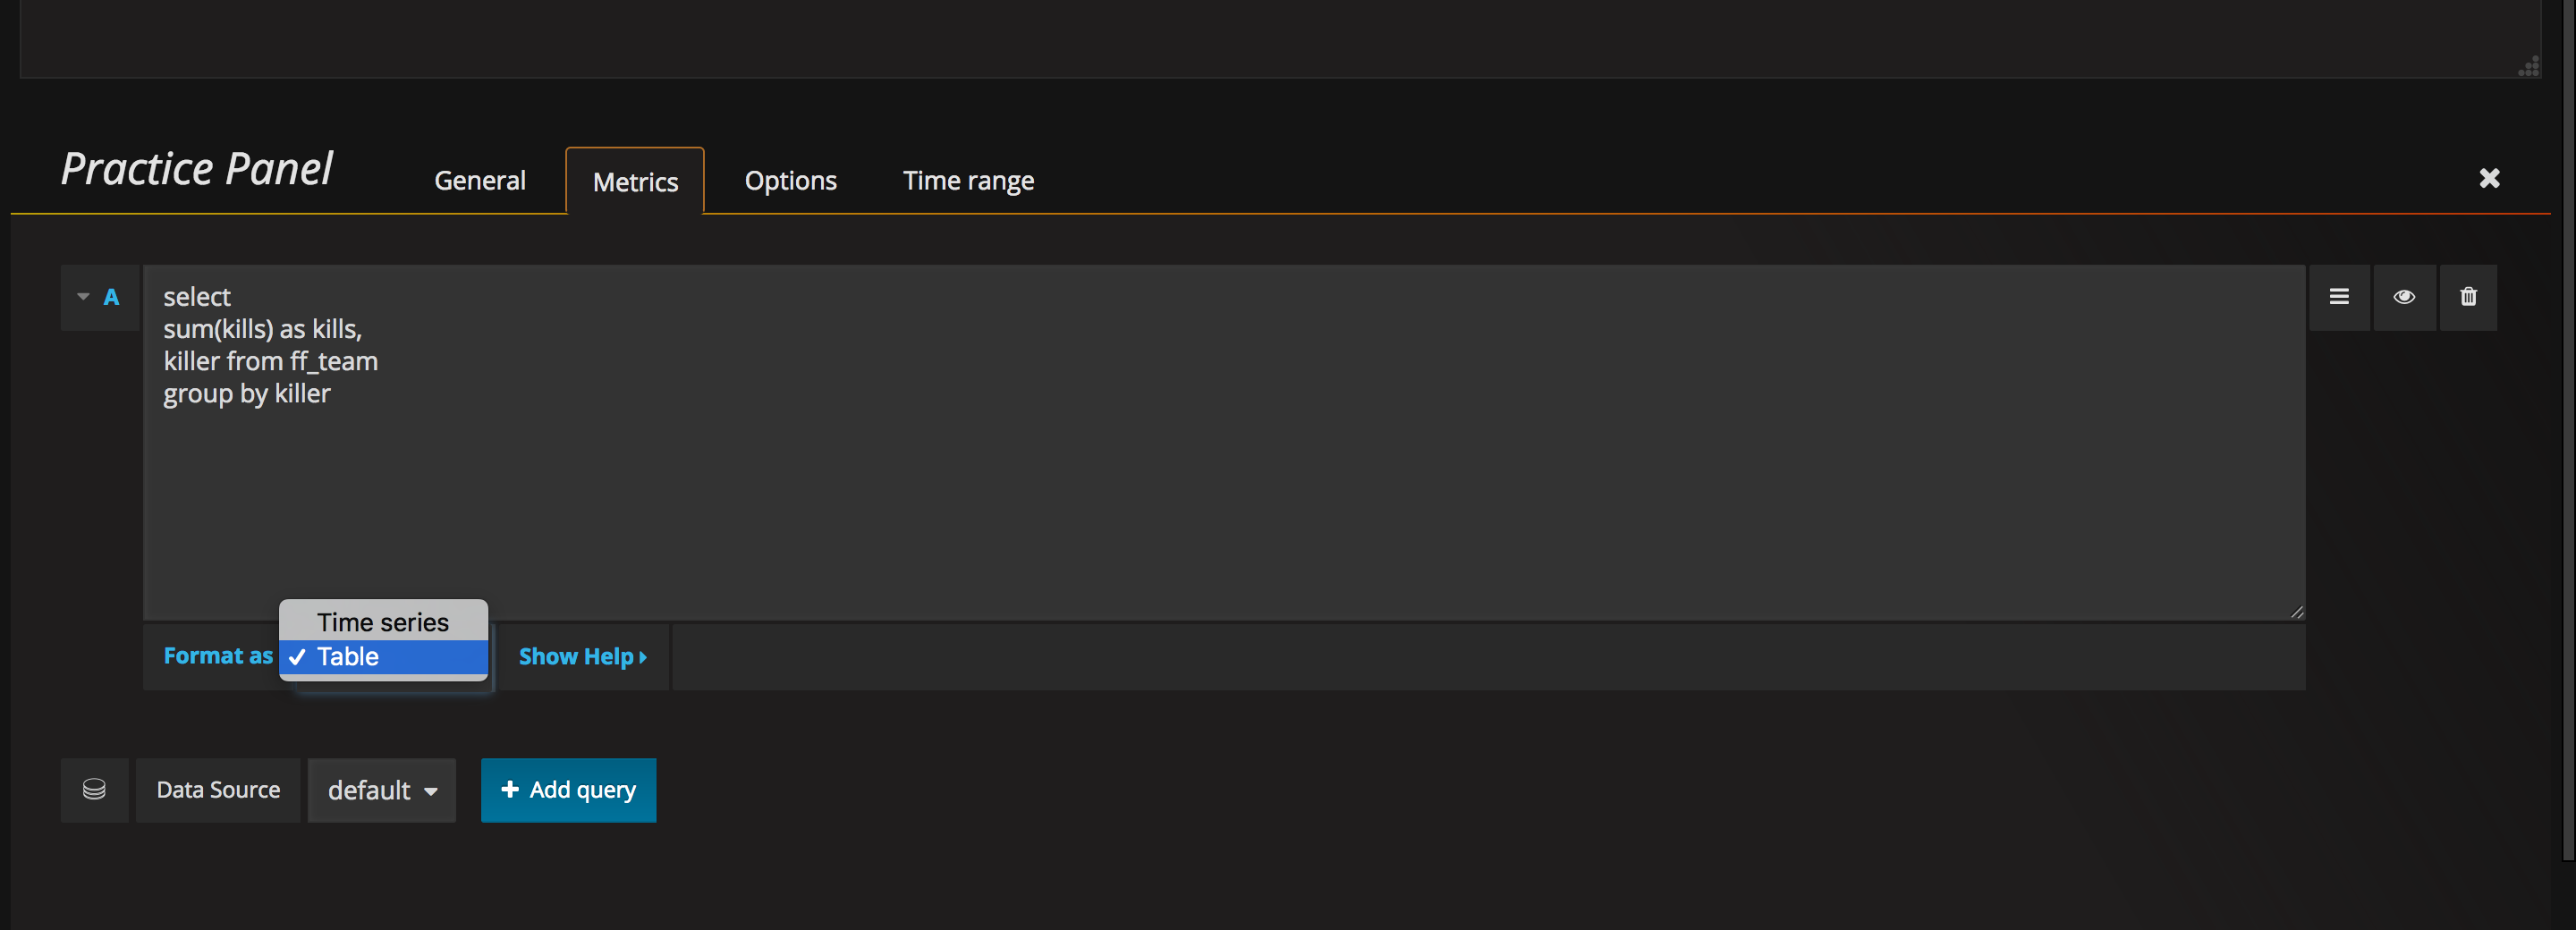 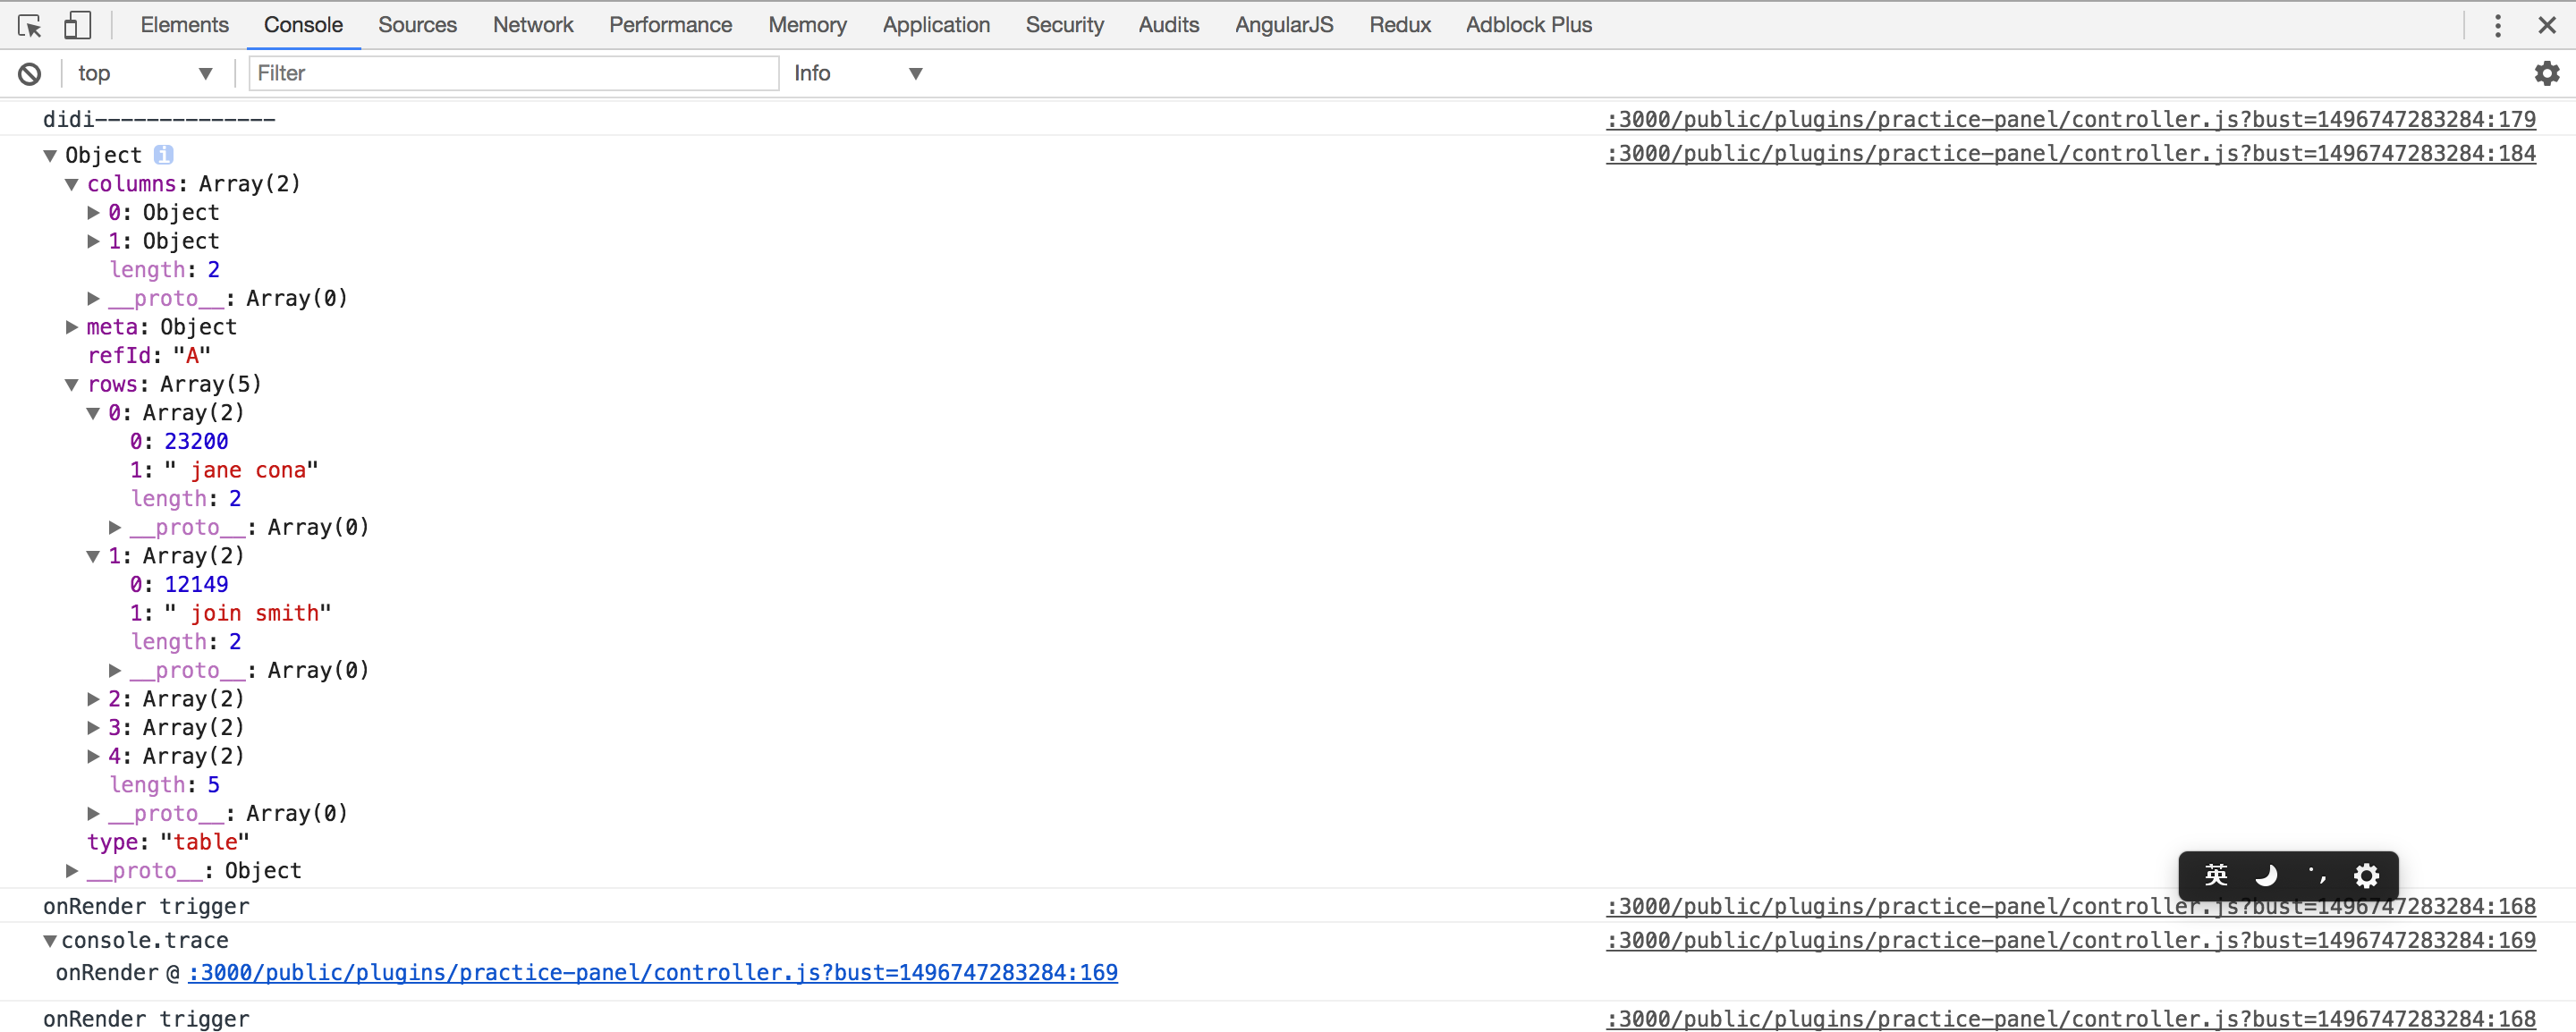 ## 附录 - [官方开发指南](http://docs.grafana.org/plugins/developing/development/) - [官方插件示例](https://github.com/grafana/piechart-panel) - [插件描述文件说明](http://docs.grafana.org/plugins/developing/plugin.json/)
