KO
|
EN
gitlite — search
Search
#android
#hacktoberfest
#javascript
#java
#ios
#php
#python
#css
#game
#dotnetnuke
#macos
#swift
ggradar
★ 355
Open GitHub ↗
radar charts with ggplot2
Download README (.md)
Explore Similar Repositories
git-changelog
:
Generates a git changelog, CLI or grunt plugin, inspired & based on Angular JS changelog generator
yatrum
:
Yatrum - Share and Discover Travel Stories, Itineraries, Travel Guides built with ♥️ using Angular 4.0.0
GoldMovies
:
👑 The GoldMovies is based on Kotlin, MVVM architecture, coroutines, dagger, koin, and material designs & animations.
black-metal-theme-neovim
:
A collection of black-metal themed neovim colorschemes.
D3D12TranslationLayer
:
A library containing utilities for mapping higher-level graphics work to D3D12
// repository documentation
Was this content helpful?
★ 0
(0 ratings)
Select Rating:
★
★
★
★
★
Submit Feedback
Recent Feedback
×
Download README
Do you want to download the
README.md
file for
ggradar
?
Download (.md)
ggradar ================ `ggradar` allows you to build radar charts (aka spider charts) with ggplot2. This package is based on [Paul Williamson’s](http://rstudio-pubs-static.s3.amazonaws.com/5795_e6e6411731bb4f1b9cc7eb49499c2082.html) code, with new aesthetics and compatibility with ggplot2 2.0. It was inspired by [d3radaR](http://www.buildingwidgets.com/blog/2015/12/9/week-49-d3radarr), an htmlwidget built by [timelyportfolio](https://github.com/timelyportfolio). ## Install `ggradar` ``` r devtools::install_github("ricardo-bion/ggradar", dependencies = TRUE) ``` ## Use `ggradar` ``` r library(ggradar) library(dplyr) library(scales) library(tibble) mtcars_radar <- mtcars %>% as_tibble(rownames = "group") %>% mutate_at(vars(-group), rescale) %>% tail(4) %>% select(1:10) ``` | group | mpg | cyl | disp | hp | drat | wt | qsec | vs | am | | :------------- | --------: | --: | --------: | --------: | --------: | --------: | --------: | -: | -: | | Ford Pantera L | 0.2297872 | 1.0 | 0.6981791 | 0.7491166 | 0.6728111 | 0.4236768 | 0.0000000 | 0 | 1 | | Ferrari Dino | 0.3957447 | 0.5 | 0.1843352 | 0.4346290 | 0.3963134 | 0.3214012 | 0.1190476 | 0 | 1 | | Maserati Bora | 0.1957447 | 1.0 | 0.5734597 | 1.0000000 | 0.3594470 | 0.5259524 | 0.0119048 | 0 | 1 | | Volvo 142E | 0.4680851 | 0.0 | 0.1244699 | 0.2014134 | 0.6221198 | 0.3239581 | 0.4880952 | 1 | 1 | ``` r ggradar(mtcars_radar) ``` 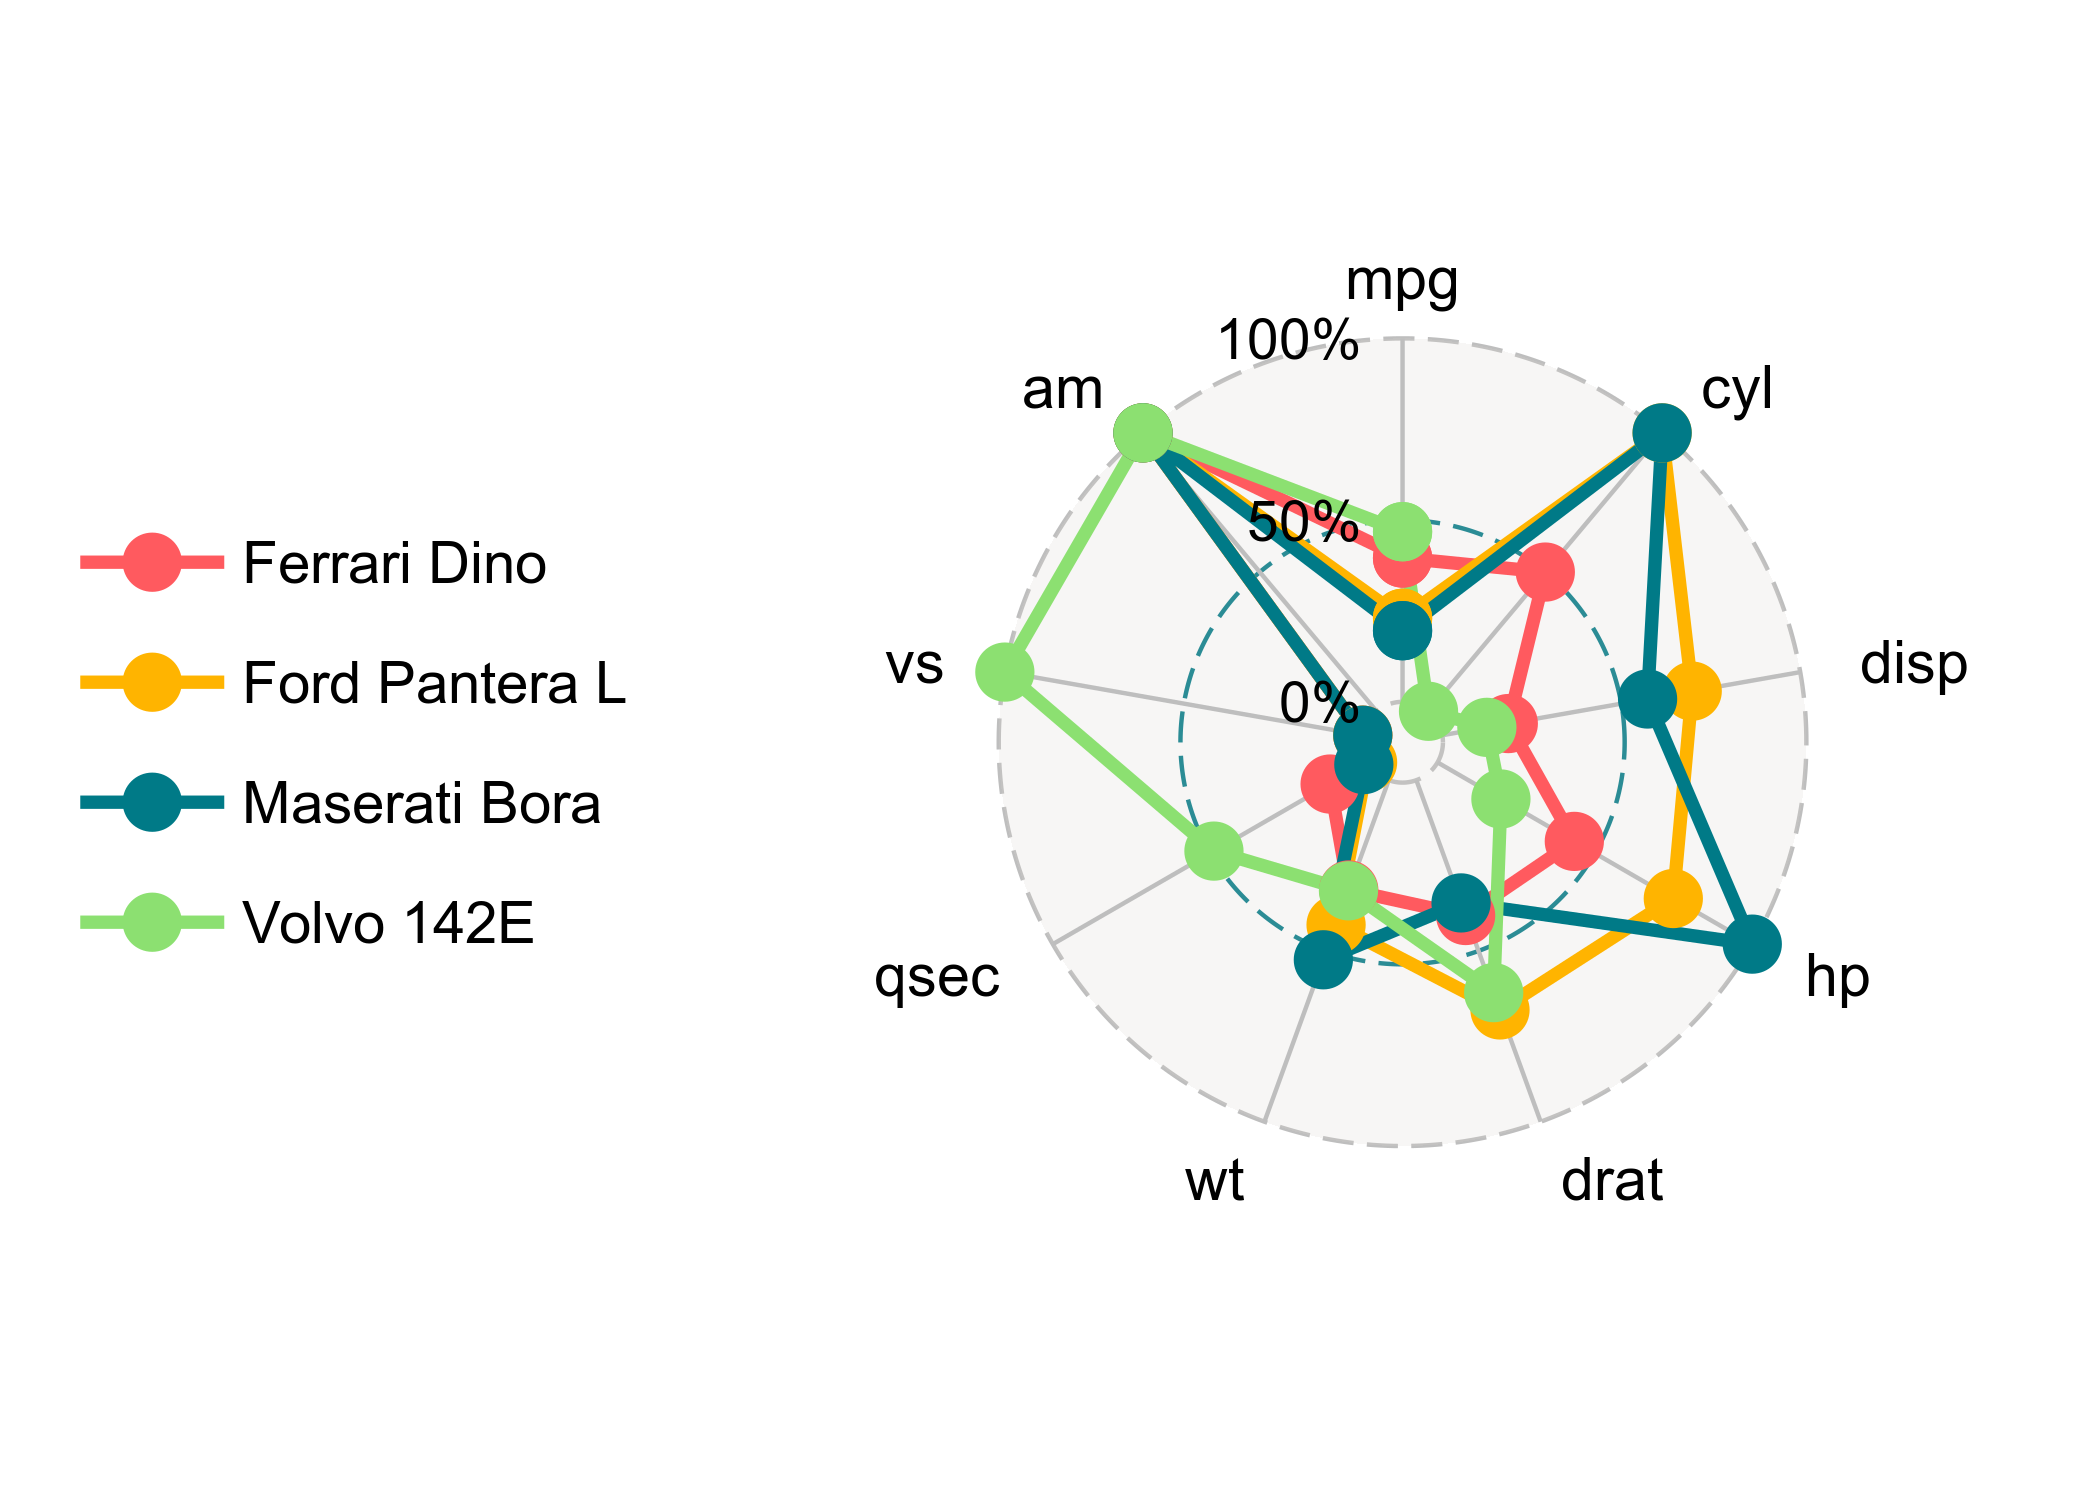<!-- --> ## Custom fonts You can also use custom font family in `ggradar`. In the following example, you would like to use Airbnb’s font family named ‘Circular Air’ by first download it, install it in your computer, and then register it to R using `extrafont` package. ``` r # configured to work on a Mac, change directory to Unix or Windows download.file("https://github.com/ricardo-bion/ggtech/blob/master/Circular%20Air-Light%203.46.45%20PM.ttf", "~/Circular Air-Light 3.46.45 PM.ttf", method = "curl") extrafont::font_import(pattern = 'Circular', prompt = FALSE) ``` Following the same procedure as in the previous example, you can then use ‘Circular Air’ font family in `ggradar` by adjusting `font.radar` argument. The following example shows that `ggradar` is also can be used in pipe `%>%`. ``` r mtcars %>% as_tibble(rownames = "group") %>% mutate_at(vars(-group), rescale) %>% tail(4) %>% select(1:10) %>% ggradar(font.radar = "Circular Air") ``` 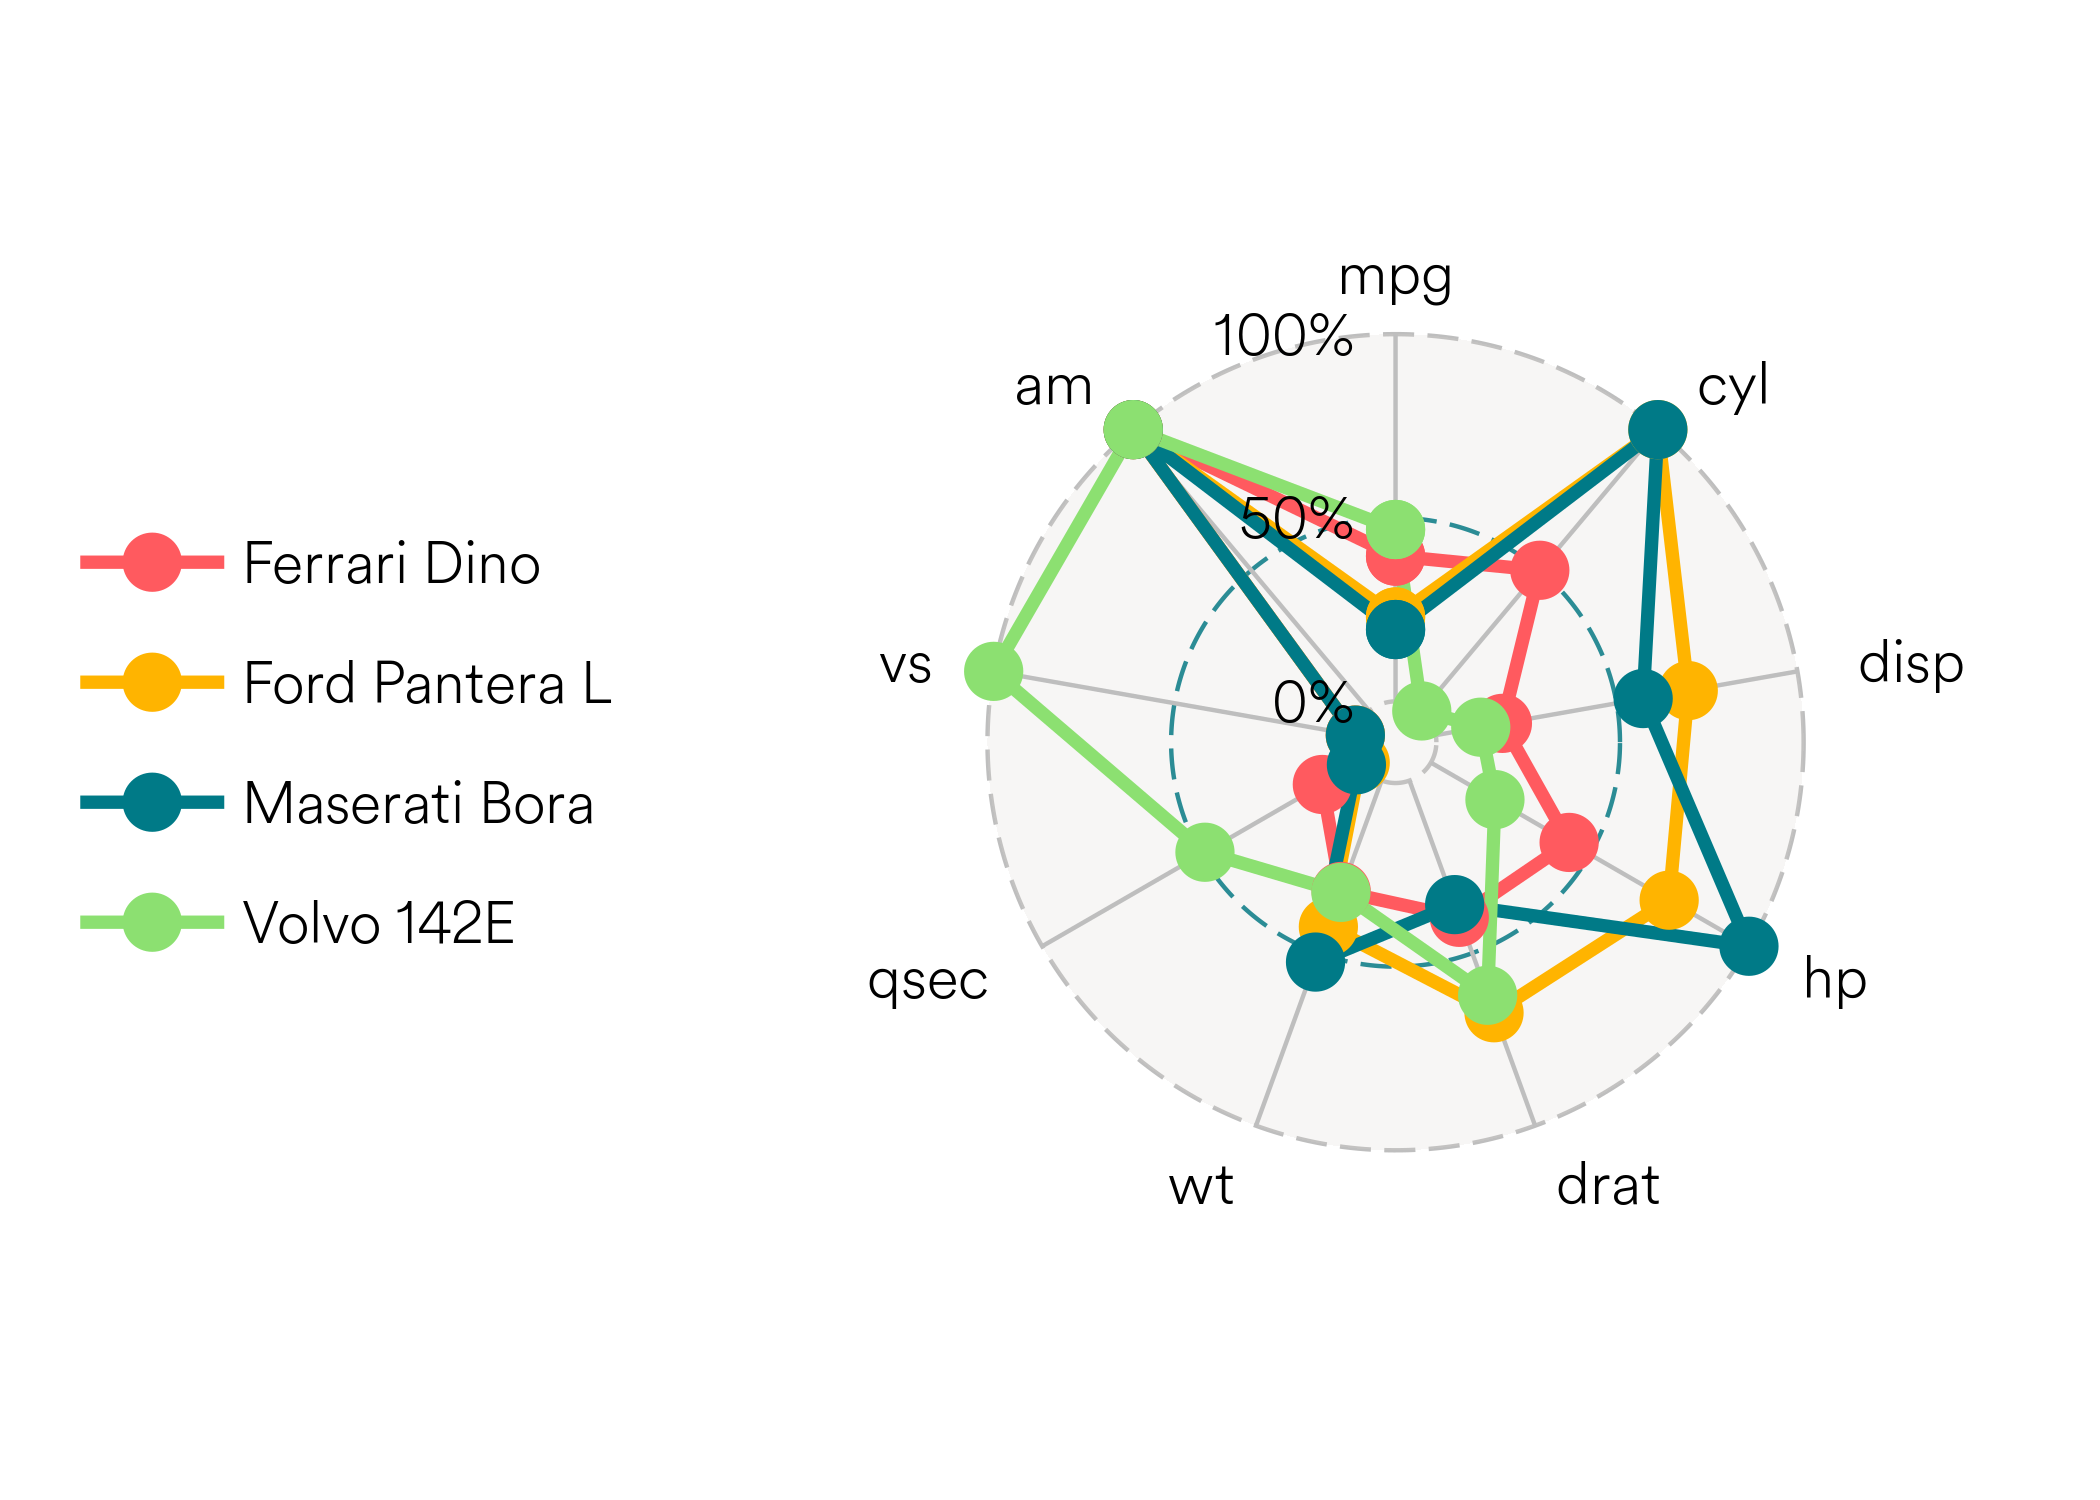<!-- -->
